down arrow

Venus Remedies

  • Market Cap: Micro Cap
  • Industry: Pharmaceuticals & Drugs
  • ISIN: INE411B01019
  • NSEID: VENUSREM
  • BSEID: 526953
303.00
-3.2 (-1.05%)
BSENSE

May 02, 04:01 PM

BSE+NSE Vol: 20.27 k

  • Price Points
  • Score
  • Mojo Parameters
  • Total Return
  • News and Corporate Actions
  • Key factors
  • Shareholding
  • Financials
  • CompanyCV
stock-summaryPrice Point
High/Low

1Day

52 Week

Valuation
Technical
Day's Volume

CASH

20.27 k (-26.89%) Volume

Shareholding (Mar 2025)

FII

1.34%

Held by 5 FIIs

DII

0.00%

Held by 0 DIIs

Promoter

41.76%

Are Venus Remedies latest results good or bad?

29-Apr-2025

Venus Remedies' latest results are positive, with a 138.31% increase in Profit Before Tax and a 72.2% rise in Profit After Tax for Q3 FY24-25, alongside a 23.32% growth in net sales and improved operating profit margins. Overall, the company is showing a strong financial turnaround.

Venus Remedies has reported strong financial results for the third quarter of FY24-25, indicating a positive turnaround for the company. The Profit Before Tax (PBT) reached Rs 12.94 crore, showing a remarkable year-on-year growth of 138.31%. Similarly, the Profit After Tax (PAT) increased to Rs 11.79 crore, a 72.2% rise compared to the same period last year.<BR><BR>Net sales also performed well, totaling Rs 176.86 crore, which reflects a year-on-year growth of 23.32%. The operating profit margin improved to 10.38%, the highest in the last five quarters, suggesting enhanced operational efficiency. Additionally, the earnings per share (EPS) reached Rs 14.66, marking the best performance in the past five quarters.<BR><BR>Overall, these results indicate that Venus Remedies is experiencing a significant positive trend in its financial performance, making the latest results good for the company.

Read More

Should I buy, sell or hold Venus Remedies?

29-Apr-2025

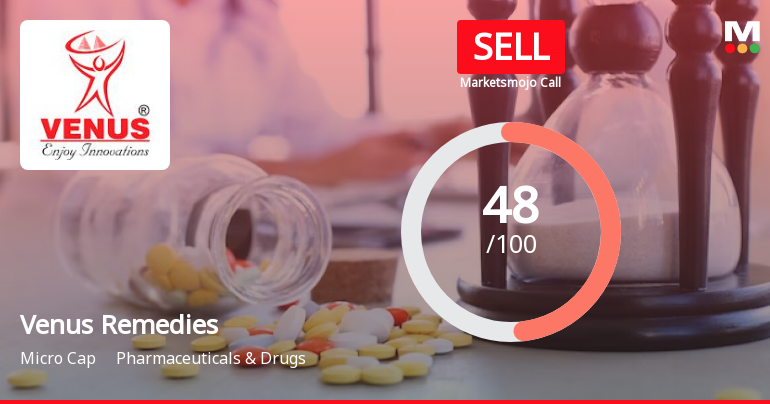
Based on the current analysis, it is advisable to sell Venus Remedies due to a Mildly Bearish trend and a -6.89% return since late April 2025, despite some positive long-term growth indicators. The overall technical outlook suggests that selling may be the prudent choice at this time.

Based on the current analysis of Venus Remedies, it appears that the recommendation leans towards selling the stock. The technical indicators suggest a Mildly Bearish trend, with the stock having generated a -6.89% return since late April 2025. Key technical factors such as MACD, Bollinger Bands, KST, and DOW also indicate bearish signals.<BR><BR>While the company does have some positive attributes, such as a low Debt to Equity ratio of 0.04, impressive long-term growth in operating profit at an annual rate of 98.02%, and a significant increase in profit before tax, these factors may not be enough to counteract the current bearish technical outlook. Additionally, the stock has seen a decline in profits of -6.9% over the past year, despite a -5.00% return.<BR><BR>Given the overall technical trend and the recent performance, it may be prudent to consider selling Venus Remedies at this time.

Read More

Who are the top shareholders of the Venus Remedies?

28-Apr-2025

The top shareholders of Venus Remedies include Sunev Pharma Solutions Limited with 17.21%, individual investors with 46.81%, and Pradeep Kumar Jain holding 2.78%. There are also 5 foreign institutional investors with a combined 1.34%, and no pledged promoter holdings or mutual fund investments.

The top shareholders of Venus Remedies include Sunev Pharma Solutions Limited, which holds the highest promoter stake at 17.21%. Additionally, individual investors collectively own 46.81% of the company. Among public shareholders, Pradeep Kumar Jain is notable with a holding of 2.78%. The company also has 5 foreign institutional investors (FIIs) that hold a combined 1.34%. There are no pledged promoter holdings or mutual fund schemes currently holding shares in the company.

Read More

Who are in the management team of Venus Remedies?

28-Apr-2025

The management team of Venus Remedies includes Pawan Chaudhary (Chairman & Managing Director), Manu Chaudhary (Joint Managing Director), Peeyush Jain (Deputy Managing Director), and several independent directors, among others, who oversee the company's governance and strategic direction.

The management team of Venus Remedies includes the following key individuals:<BR><BR>1. **Pawan Chaudhary** - Chairman & Managing Director<BR>2. **Manu Chaudhary** - Joint Managing Director<BR>3. **Peeyush Jain** - Deputy Managing Director<BR>4. **Ashutosh Jain** - Executive Director<BR>5. **Gilbert Wenzel** - Independent Director<BR>6. **S. K. Chadha** - Independent Director<BR>7. **Neha Kodan** - Company Secretary & Compliance Officer<BR>8. **Navdeep Sud** - Independent Director<BR>9. **Savita Gupta** - Independent Director<BR>10. **Akshansh Chaudhary** - Whole-time Director<BR>11. **Nps Monga** - Independent Director<BR><BR>This team plays a crucial role in the governance and strategic direction of the company.

Read More

Has Venus Remedies declared dividend?

30-Apr-2025

Yes, Venus Remedies Ltd has declared a 30% dividend, amounting to ₹3 per share, with an ex-date of September 23, 2013. However, the dividend yield is 0%, and total returns have varied across different periods, showing significant long-term gains, especially over five years.

Venus Remedies Ltd has declared a 30% dividend.<BR><BR>Dividend Details:<BR>- Percentage announced: 30%<BR>- Amount per share: 3 per share<BR>- Ex-date: 23 Sep 13<BR><BR>Dividend Yield: 0%<BR><BR>Total Returns by Period:<BR>In the 6-month period, the price return was 0.78%, the dividend return was 0%, resulting in a total return of 0.78%.<BR><BR>For the 1-year period, the price return was -4.8%, the dividend return was 0%, leading to a total return of -4.8%.<BR><BR>Over the 2-year period, the price return was 56.47%, with a dividend return of 0%, culminating in a total return of 56.47%.<BR><BR>In the 3-year period, the price return was 8.07%, the dividend return was 0%, resulting in a total return of 8.07%.<BR><BR>For the 4-year period, the price return was -0.61%, with a dividend return of 0%, leading to a total return of -0.61%.<BR><BR>In the 5-year period, the price return was 516.73%, the dividend return was 0%, resulting in a total return of 516.73%.<BR><BR>Overall, while Venus Remedies Ltd has declared a dividend, the dividend yield remains at 0%. The total returns show a mixed performance over different periods, with significant gains over the long term, particularly in the 5-year period.

Read More
iScoreScore
Click here to find our call on this stock
Strong Sell
Sell
Hold
Buy
Strong Buy
Dashboard
1

Stock is technically in a Mildly Bearish range

  • The technical trend has deteriorated from Sideways on 24-Apr-25 and has generated -9.2% returns since then
  • A key technical factor - Bollinger Band has been Bearish since 24 Apr 2025
2

Below par performance in long term as well as near term

stock-summaryMojo Parameters
Mojo Parameters
Price Summary - 04:50 PM on 02-May stock-summary
stock-summary

Performance Today

Underperformed Sector by -0.58%

stock-summary

Consecutive Fall

Stock has been losing for the last 7 days and has fallen -10.71% returns in the period

stock-summary

Moving Averages

Venus Remedies is trading lower than 5 day, 20 day, 50 day, 100 day and 200 day moving averages

stock-summary

Falling Investor Participation

Delivery Vol of 12.81 k on 30 Apr has fallen by -10.18% against 5-day avg delivery vol

Loading Valuation Snapshot...
Stock DNA
stock-summary
Industry

Pharmaceuticals & Drugs

stock-summary
Market cap

Rs 409 Cr (Micro Cap)

stock-summary
P/E

15.00

stock-summary
Industry P/E

36

stock-summary
Dividend Yield

0.00%

stock-summary
Debt Equity

-0.19

stock-summary
Return on Equity

4.47%

stock-summary
Price to Book

0.83

Revenue and Profits (1 Year):
Net Sales:
177 Cr
(Quarterly Results - Dec 2024)
Net Profit:
20 Cr
stock-summaryTotal Returns
Total Returns (Price + Dividend) stock-summary
Dividend Yield (0%)
TimePeriod
Price Return
Dividend Return
Total Return
6 Months
-3.41%
0%
-3.41%
1 Year
-6.26%
0%
-6.26%
2 Years
52.11%
0%
52.11%
3 Years
4.95%
0%
4.95%
4 Years
-3.3%
0%
-3.3%
5 Years
500.0%
0%
500.0%

Latest dividend: 3 per share ex-dividend date: Sep-23-2013

Risk Adjusted Returns v/s Sensex stock-summary
Returns Beta
Icon
Beta has not been calculated since enough price history is not available
stock-summaryNews & Corporate Actions
Announcements stock-summary

Format of the Initial Disclosure to be made by an entity identified as a Large Corporate : Annexure A

22-Apr-2025 | Source : BSE

<b>Format of Initial Disclosure to be made by an entity identified as a Large Corporate.</b><br/><br/> <table border=1px><tr> <td><b>Sr. No.</b></td> <td><b>Particulars</b></td> <td><b>Details</b></td> </tr> <tr><td>1</td><td>Name of Company</td><td>Venus Remedies Ltd</td></tr> <tr><td>2</td><td>CIN NO.</td><td>L24232CH1989PLC009705</td></tr> <tr><td>3</td> <td>Outstanding borrowing of company as on 31st March / 31st December as applicable (in Rs cr)</td> <td>0.00</td></tr> <tr><td>4</td><td>Highest Credit Rating during the previous FY </td><td>NA</td></tr> <tr><td>4a</td><td>Name of the Credit Rating Agency issuing the Credit Rating mentioned in (4)</td><td>Not Applicable</td></tr> <tr><td>5</td><td>Name of Stock Exchange# in which the fine shall be paid in case of shortfall in the required borrowing under the framework</td><td>NSE</td></tr> </table> <br/><br/> <div> <div style=float:left;> We confirm that we are a Large Corporate as per the applicability criteria given under the SEBI circular SEBI/HO/DDHS/CIR/P/2018/144 dated November 26 2018. YES</div> <br/><br/><br/> <div style=float:left;> Name of the Company Secretary: Neha <br/> Designation: Company Secretary and Compliance Officer <br/> EmailId: complianceofficer@venusremedies.com</div> <div style=float:left;margin-left:50px;> Name of the Chief Financial Officer: Pawan Chaudhary <br/> Designation: CFO <br/> EmailId: corpsec@venusremedies.com</div> </div> <div> <br/> Date: 22/04/2025<br/><br/> <b>Note:<b> In terms para of 3.2(ii) of the circular beginning F.Y 2022 in the event of shortfall in the mandatory borrowing through debt securities a fine of 0.2% of the shortfall shall be levied by Stock Exchanges at the end of the two-year block period. Therefore an entity identified as LC shall provide in its initial disclosure for a financial year the name of Stock Exchange to which it would pay the fine in case of shortfall in the mandatory borrowing through debt markets. </div>

Change In Email Address Of RTA

18-Apr-2025 | Source : BSE

Change in email address of RTA.

Announcement under Regulation 30 (LODR)-Press Release / Media Release

17-Apr-2025 | Source : BSE

USFDA grants Qualified Infectious Disease Product Designation to Venus Remedies VRP-034 a Novel Polymyxin B Formulation

Corporate Actions stock-summary
stock-summary
BOARD MEETING

No Upcoming Board Meetings

stock-summary
DIVIDEND

Venus Remedies Ltd has declared 30% dividend, ex-date: 23 Sep 13

stock-summary
SPLITS

No Splits history available

stock-summary
BONUS

No Bonus history available

stock-summary
RIGHTS

No Rights history available

stock-summaryKey Factors
Quality key factors stock-summary
Factor
Value
Sales Growth (5y)
13.19%
EBIT Growth (5y)
98.02%
EBIT to Interest (avg)
19.23
Debt to EBITDA (avg)
1.14
Net Debt to Equity (avg)
0.04
Sales to Capital Employed (avg)
1.11
Tax Ratio
40.20%
Dividend Payout Ratio
0
Pledged Shares
0
Institutional Holding
1.34%
ROCE (avg)
5.41%
ROE (avg)
6.04%
Valuation key factors
Factor
Value
P/E Ratio
15
Industry P/E
36
Price to Book Value
0.82
EV to EBIT
10.29
EV to EBITDA
5.77
EV to Capital Employed
0.78
EV to Sales
0.48
PEG Ratio
NA
Dividend Yield
NA
ROCE (Latest)
5.70%
ROE (Latest)
4.47%
Tecnicals key factors
Indicator
Weekly
Monthly
MACD
Mildly Bullish
Mildly Bearish
RSI
No Signal
No Signal
Bollinger Bands
Bearish
Bearish
Moving Averages
Bearish (Daily)
KST
Mildly Bullish
Mildly Bearish
Dow Theory
Mildly Bullish
No Trend
OBV
Bullish
No Trend
stock-summary Technical Indicator Scale: Bearish, Mildly Bearish, Sideways, Mildly Bullish, Bullish  Turned 
stock-summaryShareholding
Shareholding Snapshot : Mar 2025stock-summary
Shareholding Compare (%holding) stock-summary
Majority shareholders

Non Institution

Pledged Promoter Holdings

None

Mutual Funds

Held by 0 Schemes

FIIs

Held by 5 FIIs (1.34%)

Promoter with highest holding

Sunev Pharma Solutions Limited (17.21%)

Highest Public shareholder

Pradeep Kumar Jain (2.78%)

Individual Investors Holdings

46.81%

stock-summaryFinancial
[
  {
    "link": "quarterly",
    "btn_text": "All Quarterly Results",
    "header": "Quarterly Results Snapshot (Consolidated) - Dec'24 - YoY",
    "rhs": [
      {
        "prefix": "Net Sales ",
        "suffix": "YoY Growth in quarter ended Dec 2024 is 23.32% vs 22.69% in Dec 2023",
        "dir": 1
      },
      {
        "prefix": "Consolidated Net Profit ",
        "suffix": "YoY Growth in quarter ended Dec 2024 is 186.13% vs 108.21% in Dec 2023",
        "dir": 1
      }
    ],
    "table": {
      "header": [
        "Dec'24",
        "Dec'23",
        "Change(%)"
      ],
      "body": [
        {
          "field": "Net Sales",
          "val1": "176.86",
          "val2": "143.42",
          "chgp": "23.32%",
          "chgp_class": "positive"
        },
        {
          "field": "Operating Profit (PBDIT) excl Other Income",
          "val1": "18.36",
          "val2": "12.04",
          "chgp": "52.49%",
          "chgp_class": "positive"
        },
        {
          "field": "Interest",
          "val1": "0.01",
          "val2": "0.07",
          "chgp": "-85.71%",
          "chgp_class": "positive"
        },
        {
          "field": "Exceptional Items",
          "val1": "9.91",
          "val2": "0.00",
          "chgp": "",
          "chgp_class": "neutral"
        },
        {
          "field": "Consolidate Net Profit",
          "val1": "19.60",
          "val2": "6.85",
          "chgp": "186.13%",
          "chgp_class": "positive"
        },
        {
          "field": "Operating Profit Margin (Excl OI)",
          "val1": "10.38%",
          "val2": "8.39%",
          "chgp": "1.99%",
          "chgp_class": "positive"
        }
      ]
    }
  },
  {
    "link": "half-yearly",
    "btn_text": "All Half Yearly Results",
    "header": "Half Yearly Results Snapshot (Consolidated) - Sep'24",
    "rhs": [
      {
        "prefix": "Net Sales ",
        "suffix": " Growth in half year ended Sep 2024 is 5.02% vs -7.10% in Sep 2023",
        "dir": 1
      },
      {
        "prefix": "Consolidated Net Profit ",
        "suffix": " Growth in half year ended Sep 2024 is -57.37% vs -9.00% in Sep 2023",
        "dir": -1
      }
    ],
    "table": {
      "header": [
        "Sep'24",
        "Sep'23",
        "Change(%)"
      ],
      "body": [
        {
          "field": "Net Sales",
          "val1": "276.06",
          "val2": "262.87",
          "chgp": "5.02%",
          "chgp_class": "positive"
        },
        {
          "field": "Operating Profit (PBDIT) excl Other Income",
          "val1": "16.18",
          "val2": "28.19",
          "chgp": "-42.60%",
          "chgp_class": "negative"
        },
        {
          "field": "Interest",
          "val1": "0.04",
          "val2": "0.12",
          "chgp": "-66.67%",
          "chgp_class": "positive"
        },
        {
          "field": "Exceptional Items",
          "val1": "0.00",
          "val2": "0.00",
          "chgp": "",
          "chgp_class": "neutral"
        },
        {
          "field": "Consolidate Net Profit",
          "val1": "4.74",
          "val2": "11.12",
          "chgp": "-57.37%",
          "chgp_class": "negative"
        },
        {
          "field": "Operating Profit Margin (Excl OI)",
          "val1": "5.86%",
          "val2": "10.72%",
          "chgp": "-4.86%",
          "chgp_class": "negative"
        }
      ]
    }
  },
  {
    "link": "nine-monthly",
    "btn_text": "All Nine Monthly Results",
    "header": "Nine Monthly Results Snapshot (Consolidated) - Dec'24",
    "rhs": [
      {
        "prefix": "Net Sales ",
        "suffix": "YoY Growth in nine months ended Dec 2024 is 11.48% vs 1.61% in Dec 2023",
        "dir": 1
      },
      {
        "prefix": "Consolidated Net Profit ",
        "suffix": "YoY Growth in nine months ended Dec 2024 is 35.45% vs 15.86% in Dec 2023",
        "dir": 1
      }
    ],
    "table": {
      "header": [
        "Dec'24",
        "Dec'23",
        "Change(%)"
      ],
      "body": [
        {
          "field": "Net Sales",
          "val1": "452.92",
          "val2": "406.29",
          "chgp": "11.48%",
          "chgp_class": "positive"
        },
        {
          "field": "Operating Profit (PBDIT) excl Other Income",
          "val1": "34.54",
          "val2": "40.23",
          "chgp": "-14.14%",
          "chgp_class": "negative"
        },
        {
          "field": "Interest",
          "val1": "0.05",
          "val2": "0.19",
          "chgp": "-73.68%",
          "chgp_class": "positive"
        },
        {
          "field": "Exceptional Items",
          "val1": "9.91",
          "val2": "0.00",
          "chgp": "",
          "chgp_class": "neutral"
        },
        {
          "field": "Consolidate Net Profit",
          "val1": "24.34",
          "val2": "17.97",
          "chgp": "35.45%",
          "chgp_class": "positive"
        },
        {
          "field": "Operating Profit Margin (Excl OI)",
          "val1": "7.63%",
          "val2": "9.90%",
          "chgp": "-2.27%",
          "chgp_class": "negative"
        }
      ]
    }
  },
  {
    "link": "annual",
    "btn_text": "All Annual Results",
    "header": "Annual Results Snapshot (Consolidated) - Mar'24",
    "rhs": [
      {
        "prefix": "Net Sales ",
        "suffix": "YoY Growth in year ended Mar 2024 is 8.27% vs -7.44% in Mar 2023",
        "dir": 1
      },
      {
        "prefix": "Consolidated Net Profit ",
        "suffix": "YoY Growth in year ended Mar 2024 is 7.23% vs -34.79% in Mar 2023",
        "dir": 1
      }
    ],
    "table": {
      "header": [
        "Mar'24",
        "Mar'23",
        "Change(%)"
      ],
      "body": [
        {
          "field": "Net Sales",
          "val1": "601.45",
          "val2": "555.51",
          "chgp": "8.27%",
          "chgp_class": "positive"
        },
        {
          "field": "Operating Profit (PBDIT) excl Other Income",
          "val1": "59.60",
          "val2": "60.02",
          "chgp": "-0.70%",
          "chgp_class": "negative"
        },
        {
          "field": "Interest",
          "val1": "0.09",
          "val2": "0.12",
          "chgp": "-25.00%",
          "chgp_class": "positive"
        },
        {
          "field": "Exceptional Items",
          "val1": "0.00",
          "val2": "0.00",
          "chgp": "",
          "chgp_class": "neutral"
        },
        {
          "field": "Consolidate Net Profit",
          "val1": "28.48",
          "val2": "26.56",
          "chgp": "7.23%",
          "chgp_class": "positive"
        },
        {
          "field": "Operating Profit Margin (Excl OI)",
          "val1": "9.91%",
          "val2": "10.80%",
          "chgp": "-0.89%",
          "chgp_class": "negative"
        }
      ]
    }
  }
]
Quarterly Results Snapshot (Consolidated) - Dec'24 - YoYstock-summary
Dec'24
Dec'23
Change(%)
Net Sales
176.86
143.42
23.32%
Operating Profit (PBDIT) excl Other Income
18.36
12.04
52.49%
Interest
0.01
0.07
-85.71%
Exceptional Items
9.91
0.00
Consolidate Net Profit
19.60
6.85
186.13%
Operating Profit Margin (Excl OI)
10.38%
8.39%
1.99%
Values in Rs Cr.
Direction Arrows
Net Sales

YoY Growth in quarter ended Dec 2024 is 23.32% vs 22.69% in Dec 2023

Direction Arrows
Consolidated Net Profit

YoY Growth in quarter ended Dec 2024 is 186.13% vs 108.21% in Dec 2023

Half Yearly Results Snapshot (Consolidated) - Sep'24stock-summary
Sep'24
Sep'23
Change(%)
Net Sales
276.06
262.87
5.02%
Operating Profit (PBDIT) excl Other Income
16.18
28.19
-42.60%
Interest
0.04
0.12
-66.67%
Exceptional Items
0.00
0.00
Consolidate Net Profit
4.74
11.12
-57.37%
Operating Profit Margin (Excl OI)
5.86%
10.72%
-4.86%
Values in Rs Cr.
Direction Arrows
Net Sales

Growth in half year ended Sep 2024 is 5.02% vs -7.10% in Sep 2023

Direction Arrows
Consolidated Net Profit

Growth in half year ended Sep 2024 is -57.37% vs -9.00% in Sep 2023

Nine Monthly Results Snapshot (Consolidated) - Dec'24stock-summary
Dec'24
Dec'23
Change(%)
Net Sales
452.92
406.29
11.48%
Operating Profit (PBDIT) excl Other Income
34.54
40.23
-14.14%
Interest
0.05
0.19
-73.68%
Exceptional Items
9.91
0.00
Consolidate Net Profit
24.34
17.97
35.45%
Operating Profit Margin (Excl OI)
7.63%
9.90%
-2.27%
Values in Rs Cr.
Direction Arrows
Net Sales

YoY Growth in nine months ended Dec 2024 is 11.48% vs 1.61% in Dec 2023

Direction Arrows
Consolidated Net Profit

YoY Growth in nine months ended Dec 2024 is 35.45% vs 15.86% in Dec 2023

Annual Results Snapshot (Consolidated) - Mar'24stock-summary
Mar'24
Mar'23
Change(%)
Net Sales
601.45
555.51
8.27%
Operating Profit (PBDIT) excl Other Income
59.60
60.02
-0.70%
Interest
0.09
0.12
-25.00%
Exceptional Items
0.00
0.00
Consolidate Net Profit
28.48
26.56
7.23%
Operating Profit Margin (Excl OI)
9.91%
10.80%
-0.89%
Values in Rs Cr.
Direction Arrows
Net Sales

YoY Growth in year ended Mar 2024 is 8.27% vs -7.44% in Mar 2023

Direction Arrows
Consolidated Net Profit

YoY Growth in year ended Mar 2024 is 7.23% vs -34.79% in Mar 2023

stock-summaryCompany CV
About Venus Remedies Ltd stock-summary
stock-summary
Venus Remedies Ltd
Micro Cap
Pharmaceuticals & Drugs
Incorporated in 1989 Venus Remedies Ltd (formerly known Venus Glucose Pvt Ltd), was converted into Public Limited Company in 1994 and then changed into Venus Remedies Limited. The Company was promoted and managed by Chaudhary & Family. The Company is one of the handful player in pharmaceutical sector to launch injectables globally. It has manufacturing facilities in Panchkula and Baddi , and research and development centre under the name of Venus Medicine Research Centre (in India).
Company Coordinates stock-summary
Company Details
S C No 857 Cabin No 10 2nd Flr, N A C Manimajra Chandigarh Chandigarh ( U T ) : 160101
stock-summary
Tel:
stock-summary
investorgrievance@venusremedies.co.
Registrar Details
Link Intime India Pvt Ltd, A-40, 2nd Floor, Naraina Industrial Area , Phase II, Near Batra Banquet Hall, New Delhi