
Dashboard
Poor Management Efficiency with a low ROCE of 8.29%
- The company has been able to generate a Return on Capital Employed (avg) of 8.29% signifying low profitability per unit of total capital (equity and debt)
Low ability to service debt as the company has a high Debt to EBITDA ratio of 3.27 times
The company has declared negative results in Dec'2024 after 2 consecutive positive quarters
Stock is technically in a Bearish range
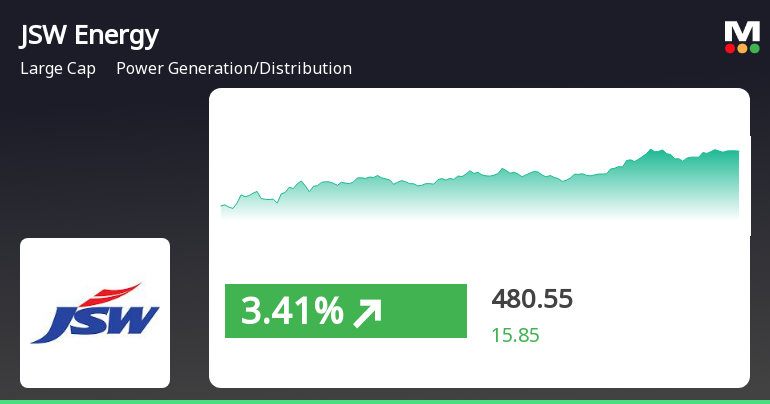
Price Summary - 04:51 PM on 02-May 

Performance Today
Underperformed Sector by -0.74%
Day's Low
Stock touched an intraday low of Rs 468.25 (-2.26%)
Weighted Average Price
More Volume traded close to Low Price
Moving Averages
JSW Energy is trading lower than 5 day, 20 day, 50 day, 100 day and 200 day moving averages
Stock DNA
Power Generation/Distribution
Rs 84,181 Cr (Large Cap)
43.00
22
0.42%
0.87
7.00%
2.99
Total Returns (Price + Dividend)
Latest dividend: 2 per share ex-dividend date: May-31-2024
Risk Adjusted Returns v/s Sensex
Returns Beta

News
JSW Energy Shows Signs of Recovery Amid Broader Market Mixed Signals
JSW Energy saw a rebound on April 30, 2025, after six days of decline, reaching an intraday high. Despite this uptick, the stock remains below key moving averages, indicating ongoing performance challenges. In the broader market, the Sensex opened higher, with mixed signals observed in market trends.
Read MoreJSW Energy Faces Mixed Technical Signals Amidst Market Underperformance
JSW Energy, a prominent player in the power generation and distribution sector, has recently undergone an evaluation revision reflecting its current market dynamics. The company’s stock price is currently at 464.70, down from a previous close of 477.40. Over the past year, JSW Energy has experienced a decline of 22.95%, contrasting with a 7.52% return from the Sensex, indicating a notable underperformance relative to the broader market. The technical summary reveals mixed signals across various indicators. The MACD shows a mildly bullish trend on a weekly basis but leans towards a mildly bearish stance monthly. Meanwhile, the Bollinger Bands and daily moving averages indicate bearish conditions. The KST presents a mildly bullish outlook weekly, yet monthly trends suggest a bearish sentiment. In terms of stock performance, JSW Energy has faced challenges, particularly in the short term, with a significant ...
Read MoreJSW Energy Sees Surge in Open Interest Amidst Ongoing Stock Decline
JSW Energy Ltd, a prominent player in the power generation and distribution sector, has experienced a notable increase in open interest (OI) today. The latest OI stands at 40,487 contracts, reflecting a rise of 3,965 contracts or 10.86% from the previous OI of 36,522. This uptick in OI comes alongside a trading volume of 15,383 contracts, indicating active market engagement. Despite this increase in OI, JSW Energy's stock has underperformed its sector, declining by 2.39% today. Over the past five days, the stock has faced consecutive losses, accumulating a total decline of 9.08%. The weighted average price suggests that more volume has been traded closer to the stock's low price, and it is currently trading below its 5-day, 20-day, 50-day, 100-day, and 200-day moving averages. Additionally, delivery volume has decreased significantly, with a reported 11.45 lakh shares delivered on April 25, marking a 36.5...
Read More Announcements
Pumped Hydro Storage Power Procurement Agreement With Uttar Pradesh Power Corporation Limited
01-May-2025 | Source : BSEPumped Hydro Storage Power Procurement Agreement with Uttar Pradesh Power Corporation Limited
Credit Rating Affirmation - JSW Energy (Utkal) Limited
23-Apr-2025 | Source : BSECredit Rating Affirmation - JSW Energy (Utkal) Limited
Acquisition Of O2 Power Midco Holdings Pte. Limited And O2 Energy SG Pte. Limited By JSW Neo Energy Limited - Update
09-Apr-2025 | Source : BSEAcquisition of O2 Power Midco Holdings Pte. Limited and O2 Energy SG Pte. Limited by JSW Neo Energy Limited - Update
Corporate Actions

No Upcoming Board Meetings

JSW Energy Ltd has declared 20% dividend, ex-date: 31 May 24

No Splits history available

No Bonus history available

No Rights history available
Quality key factors
Valuation key factors
Tecnicals key factors
 Technical Indicator Scale: Bearish, Mildly Bearish, Sideways, Mildly Bullish, Bullish Turned
 Shareholding Snapshot : Mar 2025
Shareholding Compare (%holding)
Promoters
None
Held by 33 Schemes (2.45%)
Held by 429 FIIs (13.43%)
Jsw Investments Private Limited (17.82%)
Life Insurance Corporation Of India (6.57%)
3.58%
Quarterly Results Snapshot (Consolidated) - Dec'24 - QoQ

QoQ Growth in quarter ended Dec 2024 is -24.67% vs 12.44% in Sep 2024
QoQ Growth in quarter ended Dec 2024 is -80.33% vs 63.53% in Sep 2024
Half Yearly Results Snapshot (Consolidated) - Sep'24
Growth in half year ended Sep 2024 is -1.13% vs 14.29% in Sep 2023

Growth in half year ended Sep 2024 is 20.61% vs 11.10% in Sep 2023
Nine Monthly Results Snapshot (Consolidated) - Dec'24
YoY Growth in nine months ended Dec 2024 is -1.99% vs 13.94% in Dec 2023
YoY Growth in nine months ended Dec 2024 is 12.50% vs 13.74% in Dec 2023
Annual Results Snapshot (Consolidated) - Mar'24
YoY Growth in year ended Mar 2024 is 11.17% vs 26.50% in Mar 2023
YoY Growth in year ended Mar 2024 is 16.58% vs -14.51% in Mar 2023
About JSW Energy Ltd

Company Coordinates


