down arrow

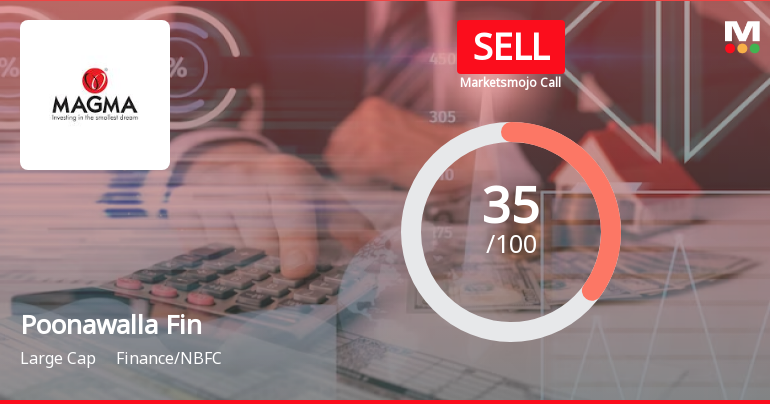
Poonawalla Fin

  • Market Cap: Large Cap
  • Industry: Finance/NBFC
  • ISIN: INE511C01022
  • NSEID: POONAWALLA
  • BSEID: 524000
377.75
4 (1.07%)
BSENSE

May 02, 04:01 PM

BSE+NSE Vol: 11.84 lacs

  • Price Points
  • Score
  • Mojo Parameters
  • Total Return
  • News and Corporate Actions
  • Key factors
  • Shareholding
  • Financials
  • CompanyCV
stock-summaryPrice Point
High/Low

1Day

52 Week

Valuation
Technical
Day's Volume

CASH

11.84 lacs (-54.75%) Volume

Shareholding (Mar 2025)

FII

9.98%

Held by 156 FIIs

DII

11.12%

Held by 24 DIIs

Promoter

62.53%

Is Poonawalla Fin technically bullish or bearish?

28-Apr-2025

Poonawalla Fincorp is currently exhibiting a mildly bullish technical trend, with a recent stock price increase and a 6.66% return over the past week. While some monthly indicators are bearish, the overall sentiment leans towards bullish, particularly in the short term.

Poonawalla Fincorp is currently exhibiting a mildly bullish technical trend. The stock price has recently increased to 407.85, reflecting a positive shift from its previous close. Over the past week, it has delivered a return of 6.66%, outperforming the Sensex, which returned 3.73%.<BR><BR>Technical indicators present a mixed picture: the MACD shows a bullish trend on a weekly basis, while it leans mildly bearish on a monthly scale. The Relative Strength Index (RSI) does not indicate significant signals for either period. Bollinger Bands suggest a bullish stance for both weekly and monthly assessments. However, daily moving averages are mildly bearish, and the KST indicates a bullish trend weekly but bearish monthly. Dow Theory also supports a mildly bullish outlook for both time frames.<BR><BR>Overall, while there are some bearish indicators on a monthly basis, the prevailing sentiment leans towards a bullish outlook, especially in the short term.

Read More

Are Poonawalla Fin latest results good or bad?

29-Apr-2025

Poonawalla Fincorp's latest results are strong, with a 113.5% increase in Profit Before Tax and record net sales of Rs 1,166.27 crore, indicating solid operational performance. However, MarketsMOJO has issued a 'Sell' call on the stock, suggesting some market caution despite the positive financial metrics.

Poonawalla Fincorp's latest results for the quarter ending March 2025 indicate a strong performance overall. The company reported a Profit Before Tax (PBT) of Rs 73.18 crore, which is a remarkable increase of 113.5% compared to the average PBT of Rs 34.27 crore from the previous four quarters. This significant growth reflects a solid operational performance.<BR><BR>Net sales also reached a record high of Rs 1,166.27 crore, demonstrating consistent growth over the last five quarters. This trend suggests that Poonawalla Fincorp is maintaining a robust market position and operational efficiency.<BR><BR>Furthermore, the Profit After Tax (PAT) for the quarter was Rs 62.33 crore, representing a growth of 45.8% compared to the average PAT of Rs 42.76 crore from the previous four quarters. The overall financial health of the company has improved significantly, with its financial score rising to 7 from -3 in the last three months.<BR><BR>However, it's worth noting that despite these positive results, MarketsMOJO has issued a 'Sell' call on the stock, which may indicate some caution in the market regarding future performance. Overall, the results can be seen as good, reflecting strong growth and improvement in key financial metrics.

Read More

Should I buy, sell or hold Poonawalla Fin?

29-Apr-2025

Based on current analysis, it is advisable to sell Poonawalla Fin shares due to poor long-term growth potential, significant profit declines, high debt levels, and unfavorable technical indicators. The stock has underperformed the market, indicating a lack of value compared to its peers.

Based on the latest analysis of Poonawalla Fin, it would be advisable to consider selling your shares. The company is facing several challenges that indicate poor long-term growth potential. The operating profit has only grown at an annual rate of 0.04%, and the profit after tax for the latest six months has seen a significant decline of 86.42%. <BR><BR>Additionally, the company has the lowest cash and cash equivalents at Rs 32.29 crore, and a concerning debt-equity ratio of 3.19 times, which suggests high leverage and financial risk. The stock's technical indicators are also unfavorable, having shifted from a mildly bullish to a mildly bearish trend, with the KST indicator remaining bearish since late April 2025.<BR><BR>With a return on equity of -1.2 and a price-to-book value of 3.7, the stock appears to be overvalued compared to its peers. Over the past year, Poonawalla Fin has underperformed the market significantly, generating negative returns of -21.50% while the broader market has seen a modest gain of 4.97%.<BR><BR>Although there is high institutional ownership at 21.1%, which can be a positive sign, the overall financial health and performance metrics suggest that selling may be the prudent choice at this time.

Read More

Who are the top shareholders of the Poonawalla Fin?

28-Apr-2025

The top shareholders of Poonawalla Fin include Rising Sun Holdings Pvt Ltd with 62.53%, 14 mutual fund schemes at 4.29%, 156 foreign institutional investors holding 9.98%, and Life Insurance Corporation of India as the largest public shareholder at 2.93%. Individual investors collectively own 12.11% of the shares.

The top shareholders of Poonawalla Fin include the promoters, with Rising Sun Holdings Pvt Ltd holding the largest share at 62.53%. Other significant shareholders are 14 mutual fund schemes that collectively hold 4.29%, and 156 foreign institutional investors (FIIs) with a combined holding of 9.98%. Additionally, Life Insurance Corporation of India is the highest public shareholder, owning 2.93%. Individual investors also have a notable presence, holding 12.11% of the shares.

Read More

Who are in the management team of Poonawalla Fin?

28-Apr-2025

As of Mar 2023 The management team of Poonawalla Fin includes Abhay Bhutada (Managing Director), ADAR CYRUS POONAWALLA (Chairman), and several Non-Executive and Independent Directors, bringing diverse expertise to the company.

As of Mar 2023 The management team of Poonawalla Fin includes the following individuals:<BR><BR>1. Abhay Bhutada - Managing Director<BR>2. Shabnum Zaman - Company Secretary & Compliance Officer<BR>3. ADAR CYRUS POONAWALLA - Chairman (Non-Executive)<BR>4. Amar Deshpande - Non-Executive Director<BR>5. Vijayalakshmi R Iyer - Non-Executive & Independent Director<BR>6. B Prasada Rao - Non-Executive & Independent Director<BR>7. Prabhakar Dalal - Non-Executive & Independent Director<BR>8. Sanjay Kumar - Non-Executive & Independent Director<BR>9. Gorinka Jaganmohan Rao - Non-Executive & Independent Director<BR>10. Atul Kumar Gupta - Non-Executive Director<BR>11. Sajit M Fazalbhoy - Non-Executive Director<BR><BR>This diverse team brings a range of expertise and experience to the company.

Read More

Has Poonawalla Fin declared dividend?

30-Apr-2025

Poonawalla Fincorp Ltd has declared a 100% dividend, amounting to ₹2 per share, with an ex-date of January 31, 2024. Despite the dividend declaration, the yield is 0%, and total returns have varied significantly over different periods, showing impressive long-term gains.

Poonawalla Fincorp Ltd has declared a 100% dividend.<BR><BR>Dividend Details:<BR>- Percentage announced: 100%<BR>- Amount per share: 2<BR>- Ex-date: 31 Jan 24<BR><BR>Dividend Yield: 0%<BR><BR>Total Returns by Period:<BR>Over the last 6 months, the price return was 2.29%, with no dividend return, resulting in a total return of 2.29%.<BR><BR>In the past year, the price return was -21.44%, and there was no dividend return, leading to a total return of -21.44%.<BR><BR>Over the last 2 years, the price return was 19.15%, with a dividend return of 1.23%, resulting in a total return of 20.38%.<BR><BR>In the last 3 years, the price return was 25.52%, and the dividend return was 1.81%, culminating in a total return of 27.33%.<BR><BR>Over the past 4 years, the price return was 224.91%, with a dividend return of 3.25%, leading to a total return of 228.16%.<BR><BR>In the last 5 years, the price return was 1947.07%, and the dividend return was 33.21%, resulting in a total return of 1980.28%.<BR><BR>Overall, Poonawalla Fincorp Ltd has declared a substantial dividend, but the dividend yield remains at 0%. The total returns over various periods show significant fluctuations, with impressive long-term gains, particularly in the 4 and 5-year periods.

Read More
iScoreScore
Click here to find our call on this stock
Strong Sell
Sell
Hold
Buy
Strong Buy
Dashboard
1

Poor long term growth as Operating profit has grown by an annual rate of 0.04%

 
2

Flat results in Mar 25

3

Stock is technically in a Mildly Bearish range

4

With ROE of -1.2, it has a Very Expensive valuation with a 3.6 Price to Book Value

5

Underperformed the market in the last 1 year

stock-summaryMojo Parameters
Mojo Parameters
Price Summary - 04:50 PM on 02-May stock-summary
stock-summary

Performance Today

Outperformed Sector by 0.76%

stock-summary

Trend Reversal

Stock has gained after 2 days of consecutive fall

stock-summary

Day's High

Stock touched an intraday high of Rs 383.8 (2.69%)

stock-summary

Moving Averages

higher than 20 day, 50 day, 100 day and 200 day moving averages but lower than 5 day moving averages

Loading Valuation Snapshot...
Stock DNA
stock-summary
Industry

Finance/NBFC

stock-summary
Market cap

Rs 29,747 Cr (Large Cap)

stock-summary
P/E

NA (Loss Making)

stock-summary
Industry P/E

21

stock-summary
Dividend Yield

0.00%

stock-summary
Debt Equity

3.19

stock-summary
Return on Equity

-1.20%

stock-summary
Price to Book

3.56

Revenue and Profits (1 Year):
Net Sales:
1,166 Cr
(Quarterly Results - Mar 2025)
Net Profit:
62 Cr
stock-summaryTotal Returns
Total Returns (Price + Dividend) stock-summary
Dividend Yield (0%)
TimePeriod
Price Return
Dividend Return
Total Return
6 Months
-0.17%
0%
-0.17%
1 Year
-23.17%
0%
-23.17%
2 Years
17.13%
1.21%
18.34%
3 Years
28.86%
1.81%
30.67%
4 Years
218.91%
3.31%
222.22%
5 Years
1909.31%
31.41%
1940.72%

Latest dividend: 2 per share ex-dividend date: Jan-31-2024

Risk Adjusted Returns v/s Sensex stock-summary
Returns Beta
Icon
Beta has not been calculated since enough price history is not available
stock-summaryNews & Corporate Actions
News
Announcements stock-summary

Announcement under Regulation 30 (LODR)-Earnings Call Transcript

02-May-2025 | Source : BSE

Intimation w.r.t Earnings Call Transcript

Announcement under Regulation 30 (LODR)-Press Release / Media Release

28-Apr-2025 | Source : BSE

Intimation w.r.t Press Release

Announcement under Regulation 30 (LODR)-Newspaper Publication

26-Apr-2025 | Source : BSE

Intimation w.r.t Newspaper Publication

Corporate Actions stock-summary
stock-summary
BOARD MEETING

No Upcoming Board Meetings

stock-summary
DIVIDEND

Poonawalla Fincorp Ltd has declared 100% dividend, ex-date: 31 Jan 24

stock-summary
SPLITS

Poonawalla Fincorp Ltd has announced 2:10 stock split, ex-date: 13 Aug 10

stock-summary
BONUS

No Bonus history available

stock-summary
RIGHTS

No Rights history available

stock-summaryKey Factors
Quality key factors stock-summary
Factor
Value
Sales Growth (5y)
10.76%
EBIT Growth (5y)
0.04%
Net Debt to Equity (avg)
2.62
Institutional Holding
21.10%
ROE (avg)
5.43%
Valuation key factors
Factor
Value
P/E Ratio
NA (Loss Making)
Industry P/E
21
Price to Book Value
3.60
EV to EBIT
41.17
EV to EBITDA
39.27
EV to Capital Employed
1.62
EV to Sales
13.23
PEG Ratio
NA
Dividend Yield
NA
ROCE (Latest)
3.93%
ROE (Latest)
-1.20%
Tecnicals key factors
Indicator
Weekly
Monthly
MACD
Bullish
Mildly Bearish
RSI
No Signal
No Signal
Bollinger Bands
Mildly Bullish
Mildly Bearish
Moving Averages
Mildly Bearish (Daily)
KST
Bullish
Bearish
Dow Theory
Mildly Bullish
No Trend
OBV
No Trend
No Trend
stock-summary Technical Indicator Scale: Bearish, Mildly Bearish, Sideways, Mildly Bullish, Bullish  Turned 
stock-summaryShareholding
Shareholding Snapshot : Mar 2025stock-summary
Shareholding Compare (%holding) stock-summary
Majority shareholders

Promoters

Pledged Promoter Holdings

None

Mutual Funds

Held by 14 Schemes (4.29%)

FIIs

Held by 156 FIIs (9.98%)

Promoter with highest holding

Rising Sun Holdings Pvt Ltd (62.53%)

Highest Public shareholder

Life Insurance Corporation Of India (2.93%)

Individual Investors Holdings

12.11%

stock-summaryFinancial
[
  {
    "link": "quarterly",
    "btn_text": "All Quarterly Results",
    "header": "Quarterly Results Snapshot (Consolidated) - Mar'25 - QoQ",
    "rhs": [
      {
        "prefix": "Net Sales ",
        "suffix": "QoQ Growth in quarter ended Mar 2025 is 10.33% vs 6.89% in Dec 2024",
        "dir": 1
      },
      {
        "prefix": "Consolidated Net Profit ",
        "suffix": "QoQ Growth in quarter ended Mar 2025 is 232.78% vs 103.98% in Dec 2024",
        "dir": 1
      }
    ],
    "table": {
      "header": [
        "Mar'25",
        "Dec'24",
        "Change(%)"
      ],
      "body": [
        {
          "field": "Net Sales",
          "val1": "1,166.27",
          "val2": "1,057.03",
          "chgp": "10.33%",
          "chgp_class": "positive"
        },
        {
          "field": "Operating Profit (PBDIT) excl Other Income",
          "val1": "551.08",
          "val2": "425.33",
          "chgp": "29.57%",
          "chgp_class": "positive"
        },
        {
          "field": "Interest",
          "val1": "458.38",
          "val2": "385.02",
          "chgp": "19.05%",
          "chgp_class": "negative"
        },
        {
          "field": "Exceptional Items",
          "val1": "0.00",
          "val2": "0.00",
          "chgp": "",
          "chgp_class": "neutral"
        },
        {
          "field": "Consolidate Net Profit",
          "val1": "62.33",
          "val2": "18.73",
          "chgp": "232.78%",
          "chgp_class": "positive"
        },
        {
          "field": "Operating Profit Margin (Excl OI)",
          "val1": "47.25%",
          "val2": "40.24%",
          "chgp": "7.01%",
          "chgp_class": "positive"
        }
      ]
    }
  },
  {
    "link": "half-yearly",
    "btn_text": "All Half Yearly Results",
    "header": "Half Yearly Results Snapshot (Consolidated) - Sep'24",
    "rhs": [
      {
        "prefix": "Net Sales ",
        "suffix": " Growth in half year ended Sep 2024 is 37.38% vs 22.08% in Sep 2023",
        "dir": 1
      },
      {
        "prefix": "Consolidated Net Profit ",
        "suffix": " Growth in half year ended Sep 2024 is -116.52% vs 257.16% in Sep 2023",
        "dir": -1
      }
    ],
    "table": {
      "header": [
        "Sep'24",
        "Sep'23",
        "Change(%)"
      ],
      "body": [
        {
          "field": "Net Sales",
          "val1": "1,966.46",
          "val2": "1,431.40",
          "chgp": "37.38%",
          "chgp_class": "positive"
        },
        {
          "field": "Operating Profit (PBDIT) excl Other Income",
          "val1": "435.30",
          "val2": "1,030.74",
          "chgp": "-57.77%",
          "chgp_class": "negative"
        },
        {
          "field": "Interest",
          "val1": "671.69",
          "val2": "445.53",
          "chgp": "50.76%",
          "chgp_class": "negative"
        },
        {
          "field": "Exceptional Items",
          "val1": "0.00",
          "val2": "848.07",
          "chgp": "-100.00%",
          "chgp_class": "negative"
        },
        {
          "field": "Consolidate Net Profit",
          "val1": "-179.40",
          "val2": "1,085.91",
          "chgp": "-116.52%",
          "chgp_class": "negative"
        },
        {
          "field": "Operating Profit Margin (Excl OI)",
          "val1": "22.14%",
          "val2": "72.01%",
          "chgp": "-49.87%",
          "chgp_class": "negative"
        }
      ]
    }
  },
  {
    "link": "nine-monthly",
    "btn_text": "All Nine Monthly Results",
    "header": "Nine Monthly Results Snapshot (Consolidated) - Dec'24",
    "rhs": [
      {
        "prefix": "Net Sales ",
        "suffix": "YoY Growth in nine months ended Dec 2024 is 37.81% vs 31.30% in Dec 2023",
        "dir": 1
      },
      {
        "prefix": "Consolidated Net Profit ",
        "suffix": "YoY Growth in nine months ended Dec 2024 is -111.89% vs 177.91% in Dec 2023",
        "dir": -1
      }
    ],
    "table": {
      "header": [
        "Dec'24",
        "Dec'23",
        "Change(%)"
      ],
      "body": [
        {
          "field": "Net Sales",
          "val1": "3,023.49",
          "val2": "2,194.01",
          "chgp": "37.81%",
          "chgp_class": "positive"
        },
        {
          "field": "Operating Profit (PBDIT) excl Other Income",
          "val1": "860.63",
          "val2": "1,615.21",
          "chgp": "-46.72%",
          "chgp_class": "negative"
        },
        {
          "field": "Interest",
          "val1": "1,056.71",
          "val2": "669.24",
          "chgp": "57.90%",
          "chgp_class": "negative"
        },
        {
          "field": "Exceptional Items",
          "val1": "0.00",
          "val2": "848.07",
          "chgp": "-100.00%",
          "chgp_class": "negative"
        },
        {
          "field": "Consolidate Net Profit",
          "val1": "-160.67",
          "val2": "1,351.05",
          "chgp": "-111.89%",
          "chgp_class": "negative"
        },
        {
          "field": "Operating Profit Margin (Excl OI)",
          "val1": "28.46%",
          "val2": "73.62%",
          "chgp": "-45.16%",
          "chgp_class": "negative"
        }
      ]
    }
  },
  {
    "link": "annual",
    "btn_text": "All Annual Results",
    "header": "Annual Results Snapshot (Consolidated) - Mar'25",
    "rhs": [
      {
        "prefix": "Net Sales ",
        "suffix": "YoY Growth in year ended Mar 2025 is 34.76% vs 60.38% in Mar 2024",
        "dir": -1
      },
      {
        "prefix": "Consolidated Net Profit ",
        "suffix": "YoY Growth in year ended Mar 2025 is -105.84% vs 146.02% in Mar 2024",
        "dir": -1
      }
    ],
    "table": {
      "header": [
        "Mar'25",
        "Mar'24",
        "Change(%)"
      ],
      "body": [
        {
          "field": "Net Sales",
          "val1": "4,189.76",
          "val2": "3,109.01",
          "chgp": "34.76%",
          "chgp_class": "positive"
        },
        {
          "field": "Operating Profit (PBDIT) excl Other Income",
          "val1": "1,411.71",
          "val2": "2,288.94",
          "chgp": "-38.32%",
          "chgp_class": "negative"
        },
        {
          "field": "Interest",
          "val1": "1,515.09",
          "val2": "950.30",
          "chgp": "59.43%",
          "chgp_class": "negative"
        },
        {
          "field": "Exceptional Items",
          "val1": "0.00",
          "val2": "848.07",
          "chgp": "-100.00%",
          "chgp_class": "negative"
        },
        {
          "field": "Consolidate Net Profit",
          "val1": "-98.34",
          "val2": "1,682.75",
          "chgp": "-105.84%",
          "chgp_class": "negative"
        },
        {
          "field": "Operating Profit Margin (Excl OI)",
          "val1": "33.69%",
          "val2": "73.62%",
          "chgp": "-39.93%",
          "chgp_class": "negative"
        }
      ]
    }
  }
]
Quarterly Results Snapshot (Consolidated) - Mar'25 - QoQstock-summary
Mar'25
Dec'24
Change(%)
Net Sales
1,166.27
1,057.03
10.33%
Operating Profit (PBDIT) excl Other Income
551.08
425.33
29.57%
Interest
458.38
385.02
19.05%
Exceptional Items
0.00
0.00
Consolidate Net Profit
62.33
18.73
232.78%
Operating Profit Margin (Excl OI)
47.25%
40.24%
7.01%
Values in Rs Cr.
Direction Arrows
Net Sales

QoQ Growth in quarter ended Mar 2025 is 10.33% vs 6.89% in Dec 2024

Direction Arrows
Consolidated Net Profit

QoQ Growth in quarter ended Mar 2025 is 232.78% vs 103.98% in Dec 2024

Half Yearly Results Snapshot (Consolidated) - Sep'24stock-summary
Sep'24
Sep'23
Change(%)
Net Sales
1,966.46
1,431.40
37.38%
Operating Profit (PBDIT) excl Other Income
435.30
1,030.74
-57.77%
Interest
671.69
445.53
50.76%
Exceptional Items
0.00
848.07
-100.00%
Consolidate Net Profit
-179.40
1,085.91
-116.52%
Operating Profit Margin (Excl OI)
22.14%
72.01%
-49.87%
Values in Rs Cr.
Direction Arrows
Net Sales

Growth in half year ended Sep 2024 is 37.38% vs 22.08% in Sep 2023

Direction Arrows
Consolidated Net Profit

Growth in half year ended Sep 2024 is -116.52% vs 257.16% in Sep 2023

Nine Monthly Results Snapshot (Consolidated) - Dec'24stock-summary
Dec'24
Dec'23
Change(%)
Net Sales
3,023.49
2,194.01
37.81%
Operating Profit (PBDIT) excl Other Income
860.63
1,615.21
-46.72%
Interest
1,056.71
669.24
57.90%
Exceptional Items
0.00
848.07
-100.00%
Consolidate Net Profit
-160.67
1,351.05
-111.89%
Operating Profit Margin (Excl OI)
28.46%
73.62%
-45.16%
Values in Rs Cr.
Direction Arrows
Net Sales

YoY Growth in nine months ended Dec 2024 is 37.81% vs 31.30% in Dec 2023

Direction Arrows
Consolidated Net Profit

YoY Growth in nine months ended Dec 2024 is -111.89% vs 177.91% in Dec 2023

Annual Results Snapshot (Consolidated) - Mar'25stock-summary
Mar'25
Mar'24
Change(%)
Net Sales
4,189.76
3,109.01
34.76%
Operating Profit (PBDIT) excl Other Income
1,411.71
2,288.94
-38.32%
Interest
1,515.09
950.30
59.43%
Exceptional Items
0.00
848.07
-100.00%
Consolidate Net Profit
-98.34
1,682.75
-105.84%
Operating Profit Margin (Excl OI)
33.69%
73.62%
-39.93%
Values in Rs Cr.
Direction Arrows
Net Sales

YoY Growth in year ended Mar 2025 is 34.76% vs 60.38% in Mar 2024

Direction Arrows
Consolidated Net Profit

YoY Growth in year ended Mar 2025 is -105.84% vs 146.02% in Mar 2024

stock-summaryCompany CV
About Poonawalla Fincorp Ltd stock-summary
stock-summary
Poonawalla Fincorp Ltd
Large Cap
Finance/NBFC
Poonawalla Fincorp Limited was erstwhile incorporated as 'Magma Fincorp Limited' on December 18, 1978 as a Private Limited Company. On October 30, 1980, the company was converted into Public Limited Company and the name was changed to Magma Leasing Limited. On June 19, 2007, the name of the company was changed from Magma Leasing Limited to Magma Shrachi Finance Limited and subsequently to Poonawalla Fincorp Limited from Magma Shrachi Finance Limited on July 12, 2021.
Company Coordinates stock-summary
Company Details
Development House, 24 Park Street Kolkata West Bengal : 700016
stock-summary
Tel: 91-33-44017350
stock-summary
secretarial@poonawallafincorp.com
Registrar Details