
Anand Rathi Wealth Faces Mixed Technical Trends Amid Market Evaluation Revision
2025-04-03 08:06:26Anand Rathi Wealth, a midcap player in the Finance/NBFC sector, has recently undergone an evaluation revision reflecting its current market dynamics. The stock is currently priced at 1885.00, showing a notable increase from the previous close of 1833.85. Over the past year, Anand Rathi Wealth has demonstrated a return of 9.42%, significantly outperforming the Sensex, which recorded a return of 3.67% in the same period. In terms of technical indicators, the MACD suggests a bearish trend on a weekly basis, while the monthly outlook is mildly bearish. The Bollinger Bands indicate a mildly bearish stance on the weekly chart, contrasting with a bullish perspective on the monthly chart. Moving averages also reflect a mildly bearish trend on a daily basis. When examining the stock's performance over various time frames, Anand Rathi Wealth has shown resilience, particularly over three years, where it achieved a r...
Read MoreAnand Rathi Wealth Faces Technical Trend Shifts Amid Market Volatility
2025-04-02 08:10:01Anand Rathi Wealth, a midcap player in the Finance/NBFC sector, has recently undergone an evaluation revision reflecting its current market dynamics. The stock is currently priced at 1833.85, down from a previous close of 1859.65, with a notable 52-week high of 2,320.28 and a low of 1,586.05. Today's trading saw a high of 1898.10 and a low of 1817.05, indicating some volatility. The technical summary reveals a bearish sentiment in the weekly MACD and Bollinger Bands, while the monthly indicators show a mildly bearish trend for MACD and a sideways movement for Bollinger Bands. The daily moving averages also reflect a bearish stance. Notably, the Relative Strength Index (RSI) shows no signals for both weekly and monthly periods, suggesting a lack of momentum in either direction. In terms of performance, Anand Rathi Wealth's stock return over the past week stands at -1.09%, contrasting with a -2.55% return f...
Read MoreAnand Rathi Wealth Faces Mixed Technical Trends Amid Market Evaluation Revision
2025-04-01 08:03:37Anand Rathi Wealth, a midcap player in the Finance/NBFC sector, has recently undergone an evaluation revision reflecting its current market dynamics. The stock is currently priced at 1859.65, showing a slight increase from the previous close of 1855.60. Over the past year, Anand Rathi Wealth has experienced a stock return of 0.75%, while the Sensex has returned 5.11% in the same period. The technical summary indicates a mixed performance across various indicators. The MACD shows a bearish trend on a weekly basis, while the monthly perspective is mildly bearish. The Relative Strength Index (RSI) presents no signal for both weekly and monthly evaluations. Bollinger Bands reflect a mildly bearish trend weekly, contrasting with a mildly bullish outlook monthly. Daily moving averages also indicate a mildly bearish stance. In terms of returns, Anand Rathi Wealth has demonstrated notable performance over a three...
Read More
Anand Rathi Wealth Hits 52-Week Low Amid Broader Market Gains and Valuation Concerns
2025-03-13 09:51:33Anand Rathi Wealth has reached a new 52-week low, continuing a four-day decline totaling 13%. The stock is trading below multiple moving averages, indicating a bearish trend. Despite the broader market's positive performance, the company's one-year performance is notably negative, although it maintains strong long-term fundamentals.
Read More
Anand Rathi Wealth Hits 52-Week Low Amidst Ongoing Decline and Strong Fundamentals
2025-03-13 09:51:32Anand Rathi Wealth has hit a new 52-week low, experiencing a 13% decline over the past four days and underperforming its sector. Despite a year-over-year drop of 14.81%, the company maintains strong fundamentals, including a high return on equity and significant growth in net sales and operating profit.
Read More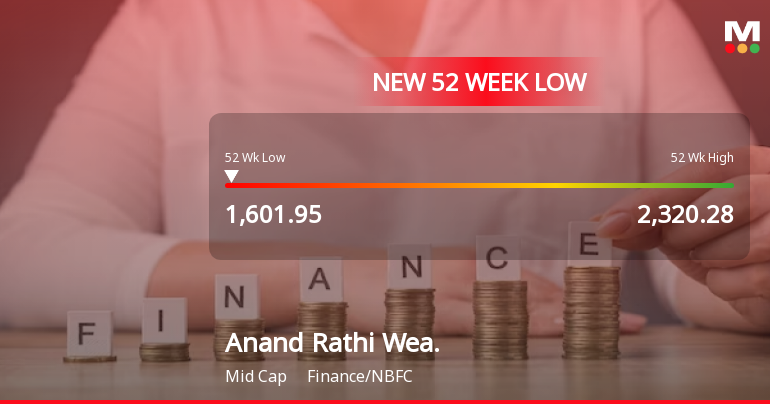
Anand Rathi Wealth Hits 52-Week Low Amid Broader Market Gains and Declining Performance
2025-03-13 09:51:32Anand Rathi Wealth has reached a new 52-week low, continuing a four-day decline and underperforming its sector. Despite a strong return on equity and significant growth in net sales, the stock's performance over the past year has been disappointing compared to broader market trends.
Read More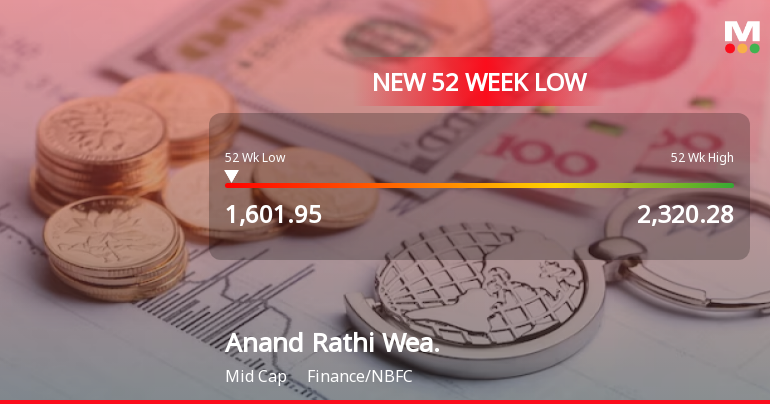
Anand Rathi Wealth Hits 52-Week Low Amid Broader Market Gains and Declining Performance
2025-03-13 09:51:31Anand Rathi Wealth has hit a new 52-week low, underperforming its sector and experiencing a four-day decline. The stock is trading below multiple moving averages, while the broader market shows slight gains. Despite a year-over-year decline, the company reports strong long-term fundamentals and growth metrics.
Read MoreAnand Rathi Wealth Faces Bearish Technical Trends Amid Market Evaluation Revision
2025-03-13 08:02:50Anand Rathi Wealth, a midcap player in the Finance/NBFC sector, has recently undergone an evaluation revision reflecting its current market dynamics. The stock is currently priced at 1648.75, down from a previous close of 1736.95, with a 52-week high of 2,320.28 and a low of 1,636.05. Today's trading saw a high of 1754.85 and a low of 1636.05. The technical summary indicates a bearish sentiment across various indicators. The MACD shows a bearish trend on a weekly basis, while the monthly perspective is mildly bearish. Bollinger Bands and moving averages also reflect bearish conditions, suggesting a cautious outlook. The KST and Dow Theory metrics present a mildly bearish stance on a weekly basis, with the On-Balance Volume showing no significant trend. In terms of performance, Anand Rathi Wealth has faced challenges compared to the Sensex. Over the past week, the stock returned -12.99%, while the Sensex s...
Read MoreAnnouncement under Regulation 30 (LODR)-Analyst / Investor Meet - Intimation
05-Apr-2025 | Source : BSEIntimation of Schedule of Q4 & FY25 Earnings Conference Call for Investors and Analysts under the SEBI (Listing Obligations and Disclosure Requirements) Regulations 2015
Disclosures under Reg. 29(2) of SEBI (SAST) Regulations 2011
01-Apr-2025 | Source : BSEThe Exchange has received the disclosure under Regulation 29(2) of SEBI (Substantial Acquisition of Shares & Takeovers) Regulations 2011 for Suresh Rathi
Disclosures under Reg. 29(2) of SEBI (SAST) Regulations 2011
01-Apr-2025 | Source : BSEThe Exchange has received the disclosure under Regulation 29(2) of SEBI (Substantial Acquisition of Shares & Takeovers) Regulations 2011 for Suresh Rathi HUF
Corporate Actions

No Upcoming Board Meetings

Anand Rathi Wealth Ltd has declared 140% dividend, ex-date: 18 Oct 24

No Splits history available

Anand Rathi Wealth Ltd has announced 1:1 bonus issue, ex-date: 05 Mar 25

No Rights history available


