
Arman Financial Services Shows Mixed Technical Trends Amid Market Evaluation Revision
2025-04-02 08:02:21Arman Financial Services, a small-cap player in the Finance/NBFC sector, has recently undergone an evaluation revision reflecting its current market dynamics. The stock is currently priced at 1340.70, showing a notable increase from the previous close of 1289.10. Over the past year, the stock has experienced a decline of 31.29%, contrasting with a modest gain of 2.72% in the Sensex during the same period. In terms of technical indicators, the weekly MACD suggests a mildly bullish sentiment, while the monthly outlook remains bearish. The Bollinger Bands indicate a bullish trend on a weekly basis but shift to mildly bearish on a monthly scale. Moving averages reflect a mildly bearish stance on a daily basis, while the KST shows a mixed picture with weekly readings leaning mildly bullish and monthly readings bearish. When comparing returns, Arman Financial has outperformed the Sensex over the year-to-date pe...
Read MoreArman Financial Services Shows Mixed Technical Trends Amid Market Evaluation Revision
2025-03-28 08:00:43Arman Financial Services, a small-cap player in the finance and non-banking financial company (NBFC) sector, has recently undergone an evaluation revision reflecting its current market dynamics. The stock is currently priced at 1269.60, down from a previous close of 1330.35, with a notable 52-week high of 2,528.05 and a low of 1,111.60. Today's trading saw a high of 1336.30 and a low of 1244.80. The technical summary indicates a mixed performance across various indicators. The MACD shows a mildly bullish trend on a weekly basis but shifts to bearish on a monthly scale. The Relative Strength Index (RSI) remains neutral, while Bollinger Bands suggest bearish conditions in the weekly timeframe. Moving averages indicate a bearish stance, and the On-Balance Volume (OBV) reflects no significant trend. In terms of returns, Arman Financial's performance has varied significantly over different periods. Year-to-dat...
Read MoreArman Financial Services Shows Mixed Technical Trends Amid Market Volatility
2025-03-24 08:00:30Arman Financial Services, a small-cap player in the finance and non-banking financial company (NBFC) sector, has recently undergone an evaluation revision reflecting its current market dynamics. The stock is currently priced at 1,438.00, showing a notable increase from the previous close of 1,267.25. Over the past year, the stock has experienced significant volatility, with a 52-week high of 2,528.05 and a low of 1,111.60. In terms of technical indicators, the weekly MACD suggests a mildly bullish trend, while the monthly perspective remains bearish. The Relative Strength Index (RSI) shows no signals for both weekly and monthly assessments. Bollinger Bands indicate a bullish stance on the weekly chart, contrasting with a mildly bearish outlook on the monthly. Moving averages reflect a mildly bearish trend on a daily basis, while the KST shows a mildly bullish weekly trend but bearish monthly results. When...
Read More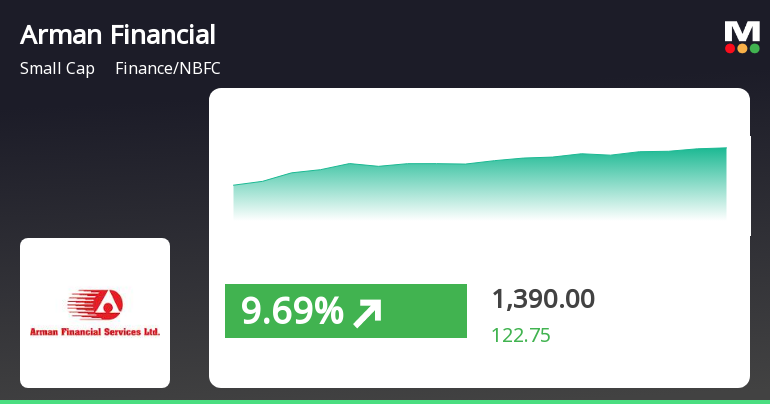
Arman Financial Services Surges Amid Market Volatility and Sector Outperformance
2025-03-21 09:30:18Arman Financial Services has experienced notable activity, achieving a significant rise and outperforming its sector. The stock has shown consistent gains over the past four days, with high volatility during trading. In contrast, the broader market, represented by the Sensex, opened lower, while small-cap stocks performed well.
Read More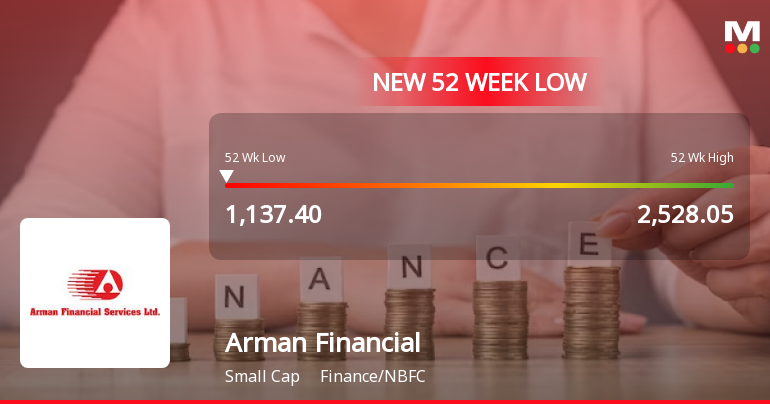
Arman Financial Services Faces Challenges Amidst Potential Trend Reversal and Declining Performance
2025-03-17 10:08:28Arman Financial Services, a small-cap finance company, is nearing its 52-week low after a significant decline over the past year. Despite recent trading gains, the stock remains below key moving averages. Financial results show a notable drop in profit and sales, while institutional investor participation has decreased.
Read More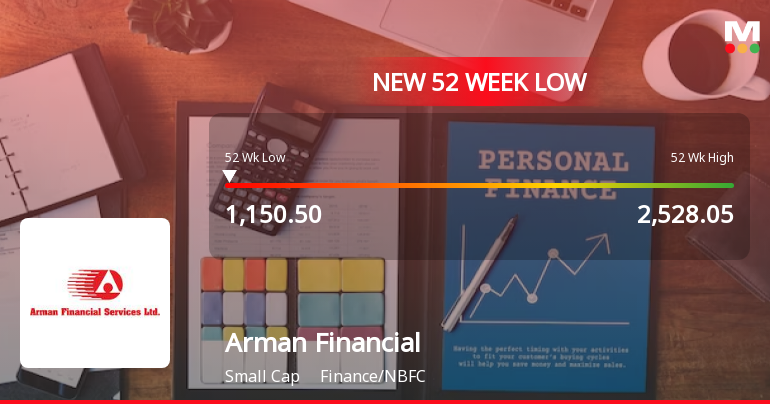
Arman Financial Services Faces Significant Volatility Amid Declining Performance Metrics
2025-03-12 14:36:25Arman Financial Services has faced notable volatility, reaching a new 52-week low and trailing its sector. The stock has declined over three consecutive days, with a significant drop in quarterly performance and reduced institutional investor participation. Despite these challenges, the company retains a long-term average Return on Equity of 16.85%.
Read MoreArman Financial Services Faces Mixed Technical Trends Amid Market Volatility
2025-03-07 08:01:22Arman Financial Services, a small-cap player in the Finance/NBFC sector, has recently undergone an evaluation revision reflecting its current market dynamics. The stock is currently priced at 1238.90, slightly down from its previous close of 1242.00. Over the past year, the stock has experienced significant volatility, with a 52-week high of 2,528.05 and a low of 1,170.20. The technical summary indicates a mixed performance across various indicators. The MACD shows a mildly bullish trend on a weekly basis, while the monthly perspective leans bearish. The Relative Strength Index (RSI) presents no clear signals for both weekly and monthly assessments. Bollinger Bands and On-Balance Volume (OBV) reflect bearish trends, suggesting caution in the stock's performance. In terms of returns, Arman Financial has faced challenges compared to the Sensex. Over the past week, the stock returned -3.10%, while the Sense...
Read MoreArman Financial Services Faces Mixed Technical Signals Amid Market Volatility
2025-02-25 10:28:10Arman Financial Services, a small-cap player in the finance/NBFC sector, has recently undergone an evaluation revision reflecting its current market dynamics. The stock is currently priced at 1303.05, slightly down from the previous close of 1304.60. Over the past year, Arman Financial has faced significant challenges, with a notable decline of 42.87% compared to a modest gain of 2.05% in the Sensex. The technical summary indicates mixed signals across various indicators. The MACD shows a mildly bullish trend on a weekly basis but shifts to bearish on a monthly scale. Similarly, the Bollinger Bands and moving averages reflect bearish sentiments, while the KST presents a mildly bullish outlook weekly but turns bearish monthly. The overall technical landscape suggests a cautious approach as the stock navigates through these fluctuations. In terms of returns, Arman Financial has shown resilience over longer ...
Read More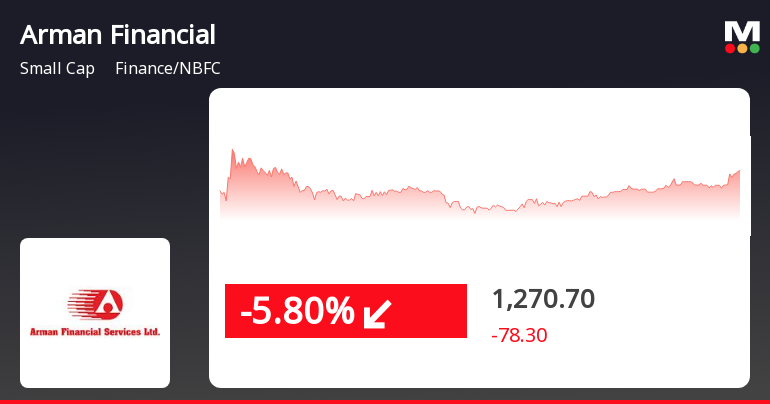
Arman Financial Services Faces Increased Volatility Amid Broader Market Challenges
2025-02-17 10:00:15Arman Financial Services has faced notable stock volatility, experiencing a decline over two consecutive days. The stock opened significantly lower and reached an intraday low, trading below key moving averages. Over the past month, it has underperformed relative to broader market indices, reflecting ongoing challenges in the sector.
Read MoreCompliances-Half Yearly Report (SEBI Circular No. CIR/IMD/DF-1/67/2017)
08-Apr-2025 | Source : BSEHalf Yearly Report under (SEBI Circular No. CIR/IMD/DF-/67/2017)
Compliances-Certificate under Reg. 74 (5) of SEBI (DP) Regulations 2018
08-Apr-2025 | Source : BSECertificate in terms of Regulation 74 (5) of SEBI (Depositories and Participants) Regulations 2018
Intimation Of Tax Ascertained Notice Received By The Subsidiary Company
01-Apr-2025 | Source : BSEIntimation of Tax Ascertained Notice Received by the Subsidiary Company
Corporate Actions

No Upcoming Board Meetings

Arman Financial Services Ltd has declared 14% dividend, ex-date: 13 Sep 19

No Splits history available

No Bonus history available

No Rights history available


