
Atul's Stock Faces Bearish Technical Trends Amid Mixed Performance Indicators
2025-04-02 08:01:52Atul, a midcap player in the chemicals industry, has recently undergone an evaluation revision reflecting its current market dynamics. The stock is currently priced at 5,798.70, down from a previous close of 6,083.55, with a notable 52-week high of 8,165.25 and a low of 5,151.00. Today's trading saw a high of 6,120.00 and a low of 5,782.35. The technical summary indicates a bearish sentiment across various indicators. The MACD shows bearish trends on both weekly and monthly scales, while Bollinger Bands also reflect a bearish outlook. Moving averages on a daily basis align with this sentiment, further emphasizing the current market position. Notably, the KST presents a mixed signal, being bearish weekly but bullish monthly. In terms of performance, Atul's stock return over the past week has shown a slight gain of 0.16%, contrasting with a decline of 2.55% in the Sensex. Over the past month, Atul has outpe...
Read MoreAtul Adjusts Valuation Grade Amid Competitive Chemicals Sector Landscape
2025-04-01 08:00:06Atul, a midcap player in the chemicals industry, has recently undergone a valuation adjustment, reflecting its current financial metrics and market position. The company's price-to-earnings (PE) ratio stands at 43.07, while its price-to-book value is recorded at 3.19. Additionally, Atul's enterprise value to EBITDA ratio is 20.96, and its enterprise value to sales ratio is 3.28. The company also shows a return on capital employed (ROCE) of 9.03% and a return on equity (ROE) of 6.74%. In comparison to its peers, Atul's valuation metrics indicate a competitive stance within the chemicals sector. For instance, Vinati Organics has a PE ratio of 42.55, while Aarti Industries is positioned with a PE of 38.78. Notably, Clean Science exhibits a higher PE ratio of 47.6, suggesting varying market perceptions among these companies. Atul's stock performance has shown fluctuations, with a current price of 6083.55, ref...
Read More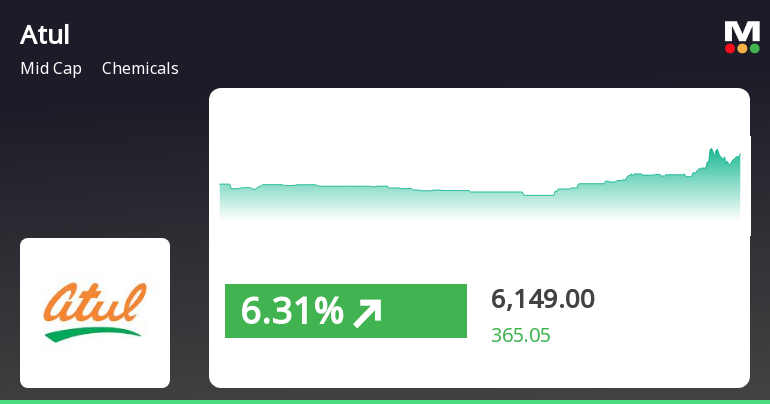
Atul Ltd. Shows Strong Short-Term Gains Amid Broader Market Decline
2025-03-28 15:15:16Atul Ltd. has experienced significant stock activity, outperforming its sector and achieving consecutive gains over two days. The stock is currently above several short-term moving averages but below longer-term ones. In the broader market, the Sensex has seen a slight decline, while Atul has outperformed it over the past month.
Read MoreAtul's Stock Shows Mixed Technical Trends Amid Market Evaluation Revision
2025-03-28 08:00:34Atul, a midcap player in the chemicals industry, has recently undergone an evaluation revision reflecting its current market dynamics. The stock is currently priced at 5,783.95, showing a slight increase from the previous close of 5,737.85. Over the past week, Atul has demonstrated a stock return of 2.37%, outperforming the Sensex, which returned 1.65% in the same period. In terms of technical indicators, the weekly MACD and moving averages suggest a bearish sentiment, while the monthly KST indicates a bullish trend. The Bollinger Bands reflect a mildly bearish stance on both weekly and monthly assessments. Notably, the stock's 52-week high stands at 8,165.25, with a low of 5,151.00, indicating significant volatility over the past year. When examining the company's performance over various time frames, Atul has faced challenges, particularly in the year-to-date return, which shows a decline of 16.90%, co...
Read MoreAtul Faces Technical Trend Challenges Amidst Market Volatility in Chemicals Sector
2025-03-27 08:00:25Atul, a midcap player in the chemicals industry, has recently undergone an evaluation revision reflecting its current market dynamics. The stock is currently priced at 5737.85, down from a previous close of 5789.35, with a notable 52-week high of 8,165.25 and a low of 5,151.00. Today's trading saw a high of 5840.45 and a low of 5734.95, indicating some volatility. The technical summary reveals a bearish sentiment across various indicators. The MACD shows bearish trends on both weekly and monthly scales, while Bollinger Bands indicate a bearish stance on the weekly and a mildly bearish outlook on the monthly. Moving averages also reflect a bearish trend on a daily basis. The KST presents a mixed picture, being bearish weekly but bullish monthly, which adds complexity to the overall assessment. In terms of performance, Atul's stock return over the past week stands at 1.17%, compared to a 2.44% return for th...
Read MoreAtul's Stock Evaluation Reflects Complex Market Dynamics and Technical Trends
2025-03-18 08:00:34Atul, a midcap player in the chemicals industry, has recently undergone an evaluation revision reflecting its current market dynamics. The stock is currently priced at 5,832.50, showing a notable increase from the previous close of 5,526.50. Over the past week, Atul has demonstrated a stock return of 2.32%, significantly outperforming the Sensex, which returned just 0.07% in the same period. In terms of technical indicators, the weekly MACD and moving averages indicate a bearish sentiment, while the Bollinger Bands suggest a mildly bearish outlook. The KST presents a mixed picture with a bearish weekly trend and a bullish monthly trend. Notably, the Dow Theory indicates a mildly bullish stance on a weekly basis, although the monthly trend shows no clear direction. When examining the company's performance over various time frames, Atul has faced challenges, particularly in the year-to-date return, which st...
Read More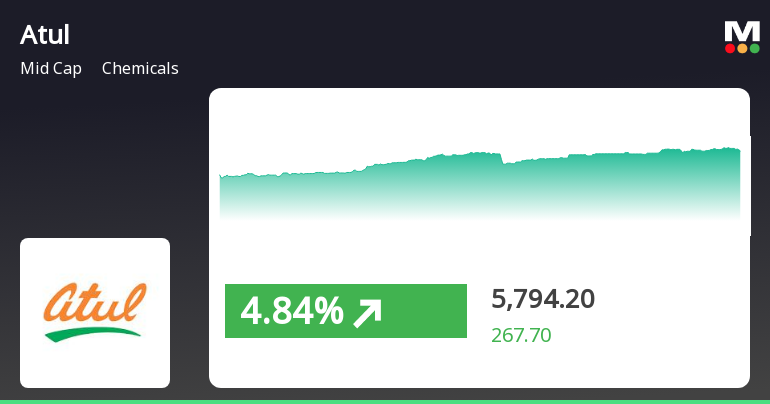
Atul Ltd. Shows Signs of Trend Reversal Amid Broader Market Gains
2025-03-17 15:00:17Atul Ltd., a midcap chemicals company, experienced a significant uptick on March 17, 2025, following a four-day decline. The stock reached an intraday high and has shown improved performance over the past week and month, despite facing longer-term challenges. It is currently trading above some moving averages.
Read MoreAtul Chemicals Faces Mixed Technical Trends Amid Market Volatility
2025-03-05 08:00:23Atul, a midcap player in the chemicals industry, has recently undergone an evaluation revision reflecting current market conditions. The stock is currently priced at 5,528.40, showing a slight increase from the previous close of 5,507.05. Over the past week, Atul has experienced a notable high of 5,550.00 and a low of 5,364.05, indicating some volatility. In terms of technical indicators, the MACD signals bearish trends on both weekly and monthly scales, while the Relative Strength Index (RSI) shows bullish momentum on a weekly basis but no significant signal monthly. Bollinger Bands reflect a mildly bearish stance in both weekly and monthly assessments. Daily moving averages also indicate bearish conditions, and the KST presents a mixed picture with bearish weekly trends and bullish monthly signals. When comparing Atul's stock performance to the Sensex, the company has shown varied returns. Over the past...
Read MoreAtul Chemicals Faces Mixed Technical Signals Amidst Market Evaluation Revision
2025-03-04 08:01:32Atul, a midcap player in the chemicals industry, has recently undergone an evaluation revision reflecting its current market dynamics. The stock is currently priced at 5,507.05, showing a notable increase from the previous close of 5,304.10. Over the past year, Atul has experienced a 10.85% decline, contrasting with a modest 0.98% drop in the Sensex, indicating a relative underperformance. The technical summary reveals mixed signals across various indicators. The MACD shows bearish trends on both weekly and monthly scales, while the KST indicates a bullish monthly outlook despite a bearish weekly stance. The RSI presents a bullish weekly signal, yet lacks a definitive monthly signal. Bollinger Bands and moving averages suggest a mildly bearish trend, reflecting cautious market sentiment. In terms of returns, Atul's performance has been particularly challenging over the longer term, with a significant 37.6...
Read MoreCompliances-Certificate under Reg. 74 (5) of SEBI (DP) Regulations 2018
07-Apr-2025 | Source : BSELetter attached
Update On Insurance Claim Of Fire Incident Of April 20 2022 At Atul Site
01-Apr-2025 | Source : BSELetter attached
Imposition Of Damages By Way Of Penalty And Interest On Provident Fund Contributions.
01-Apr-2025 | Source : BSELetter attached
Corporate Actions

No Upcoming Board Meetings

Atul Ltd. has declared 200% dividend, ex-date: 12 Jul 24

No Splits history available

No Bonus history available

No Rights history available


