CEAT Experiences Mixed Technical Trends Amidst Strong Long-Term Performance
2025-03-20 08:00:53CEAT, a midcap player in the Tyres & Allied industry, has recently undergone an evaluation revision reflecting its current market dynamics. The stock is currently priced at 2750.00, showing a slight increase from the previous close of 2735.70. Over the past year, CEAT has demonstrated a return of 7.75%, outperforming the Sensex, which recorded a return of 4.77% in the same period. In terms of technical indicators, the MACD shows a bearish trend on a weekly basis while indicating a mildly bearish stance monthly. The Bollinger Bands present a mildly bearish outlook weekly, contrasting with a bullish signal monthly. The daily moving averages remain bearish, while the KST reflects a bearish trend weekly and mildly bearish monthly. The On-Balance Volume (OBV) indicates a mildly bullish trend weekly but shifts to mildly bearish on a monthly basis. CEAT's performance over various time frames highlights its resil...
Read MoreCEAT Experiences Technical Trend Adjustments Amidst Strong Long-Term Performance
2025-03-17 08:00:21CEAT, a prominent player in the Tyres & Allied industry, has recently undergone a technical trend adjustment reflecting shifts in its market performance. The company's current stock price stands at 2637.95, slightly above its previous close of 2602.95. Over the past year, CEAT has demonstrated resilience with a return of 5.57%, outperforming the Sensex, which recorded a return of 1.47% during the same period. In terms of technical indicators, the MACD shows a bearish trend on a weekly basis, while the monthly outlook is mildly bearish. The Relative Strength Index (RSI) indicates no significant signals for both weekly and monthly assessments. Bollinger Bands reflect a mildly bearish trend weekly, with a sideways movement monthly. Daily moving averages also suggest a bearish sentiment, aligning with the overall technical summary. CEAT's performance over various time frames highlights its ability to navigate...
Read MoreCEAT Ltd Shows Mixed Performance Amid Market Fluctuations and Long-Term Growth Potential
2025-03-13 18:00:15CEAT Ltd, a mid-cap player in the Tyres & Allied industry, has shown notable activity in the stock market today. The company, with a market capitalization of Rs 10,466.00 crore, is currently trading at a price-to-earnings (P/E) ratio of 20.71, which is below the industry average of 23.24. In terms of performance, CEAT has outperformed the Sensex over the past year, delivering a return of 5.57% compared to the Sensex's 1.47%. On a daily basis, CEAT's stock has increased by 1.34%, while the Sensex has dipped by 0.27%. Over the past week, CEAT has gained 2.56%, contrasting with a 0.69% decline in the Sensex. However, the stock has faced challenges in the longer term, with a year-to-date performance of -18.58%, significantly underperforming the Sensex's -5.52%. Despite these fluctuations, CEAT has shown impressive growth over three, five, and ten-year periods, with returns of 161.71%, 210.82%, and 238.42%, r...
Read More
CEAT's Recent Gains Highlight Divergence in Midcap Market Performance Amid Broader Declines
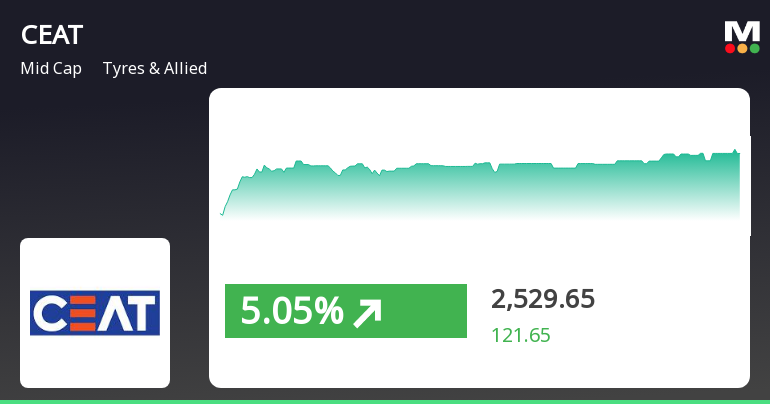
2025-03-05 12:45:15CEAT, a midcap tyre manufacturer, experienced a notable gain of 5.06% on March 5, 2025, following two days of increases. Despite this uptick, the stock remains below key moving averages and has seen a decline of 21.92% year-to-date, contrasting with broader market trends.
Read MoreCEAT Faces Mixed Technical Trends Amid Market Evaluation Revision
2025-02-28 08:00:38CEAT, a midcap player in the Tyres & Allied industry, has recently undergone an evaluation revision reflecting its current market dynamics. The stock is currently priced at 2,582.85, down from a previous close of 2,697.60. Over the past year, CEAT has experienced a decline of 10.10%, contrasting with a modest gain of 2.08% in the Sensex during the same period. The company's performance metrics reveal a mixed technical landscape. The MACD indicators suggest a bearish sentiment on both weekly and monthly scales, while the Bollinger Bands also indicate bearish conditions. However, the daily moving averages show a mildly bullish trend, indicating some short-term resilience. In terms of returns, CEAT has faced challenges, with a year-to-date decline of 20.28%, significantly underperforming the Sensex, which has only dipped by 4.51% in the same timeframe. Notably, CEAT has shown strong performance over longer...
Read More
CEAT Faces Significant Stock Decline Amid Broader Industry Challenges
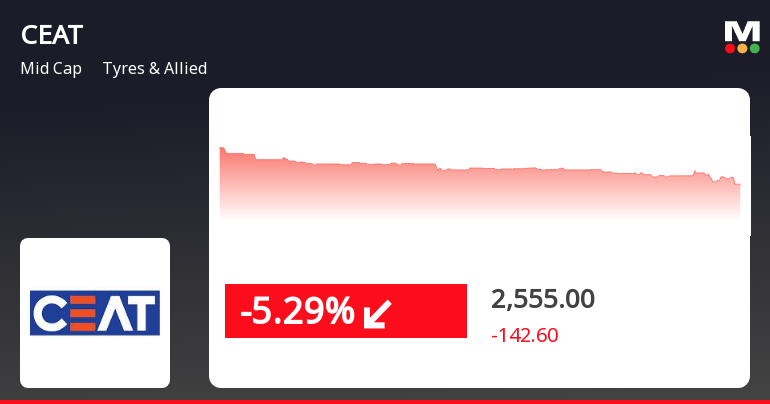
2025-02-27 15:45:13CEAT, a midcap player in the Tyres & Allied industry, has faced a notable decline in its stock price, underperforming compared to its sector. Currently trading below key moving averages, the company has seen a significant drop over the past month, reflecting challenges in the market environment.
Read MoreCEAT Faces Technical Trend Shifts Amidst Market Evaluation Revision
2025-02-25 10:28:23CEAT, a midcap player in the Tyres & Allied industry, has recently undergone an evaluation revision reflecting its current market dynamics. The stock is currently priced at 2637.95, slightly down from the previous close of 2642.65. Over the past year, CEAT has experienced a decline of 9.50%, contrasting with a modest gain of 2.09% in the Sensex during the same period. In terms of technical indicators, the weekly MACD shows a bearish trend, while the monthly MACD is mildly bearish. The Relative Strength Index (RSI) indicates no significant signals on both weekly and monthly charts. Bollinger Bands reflect a bearish stance on the weekly scale, with a sideways trend observed monthly. Moving averages present a mildly bullish outlook on a daily basis, while the KST shows a mildly bearish trend across both weekly and monthly evaluations. Despite recent challenges, CEAT has demonstrated resilience over longer ...
Read More
CEAT Faces Declining Sales and Profit Amidst Ongoing Financial Challenges
2025-02-24 18:14:26CEAT, a midcap player in the Tyres & Allied industry, has recently experienced a change in evaluation amid declining net sales and consecutive quarterly losses. Key metrics show a low operating profit to interest ratio and a significant drop in profit after tax, although the company maintains a positive long-term growth outlook.
Read More
CEAT Faces Financial Challenges in Q3 FY24-25 Amid Declining Sales and Profitability
2025-02-05 18:45:54CEAT, a midcap player in the Tyres & Allied industry, has recently experienced a change in evaluation amid a challenging financial landscape marked by declining net sales and profit after tax. Despite these difficulties, the company maintains an attractive valuation and has consistently outperformed the BSE 500 index over the past three years.
Read MoreCompliances-Certificate under Reg. 74 (5) of SEBI (DP) Regulations 2018
08-Apr-2025 | Source : BSECompany has informed the exchange about certificate under Regulation 74(5) of SEBI (DP) Regulations 2018 for the quarter ended March 31 2025
CEAT Limited Has Informed The Exchange About Loss Of Share Certificate(S).
03-Apr-2025 | Source : BSECEAT Limited has informed the Exchange about Loss of Share Certificate(s).
Closure of Trading Window
27-Mar-2025 | Source : BSECEAT Limited has informed the exchange regarding Closure of Trading Window
Corporate Actions
No Upcoming Board Meetings
CEAT Ltd has declared 300% dividend, ex-date: 09 Aug 24
No Splits history available
No Bonus history available
No Rights history available


