
Himatsingka Seide Faces Mixed Technical Trends Amid Market Volatility and Performance Evaluation
2025-04-02 08:02:31Himatsingka Seide, a small-cap player in the textile industry, has recently undergone an evaluation revision reflecting its current market dynamics. The company's technical indicators present a mixed picture, with the MACD showing bearish trends on a weekly basis and mildly bearish on a monthly basis. The Bollinger Bands indicate a mildly bearish stance weekly, while the monthly outlook appears bullish. Moving averages also suggest a mildly bearish trend on a daily basis. In terms of performance metrics, Himatsingka Seide's stock price recently closed at 152.10, up from a previous close of 140.90. The stock has experienced a 52-week high of 231.60 and a low of 107.50, indicating significant volatility over the past year. When comparing the company's returns to the Sensex, Himatsingka Seide has shown resilience in the short term, with a 1-week return of 3.12%, contrasting with a decline in the Sensex of 2...
Read More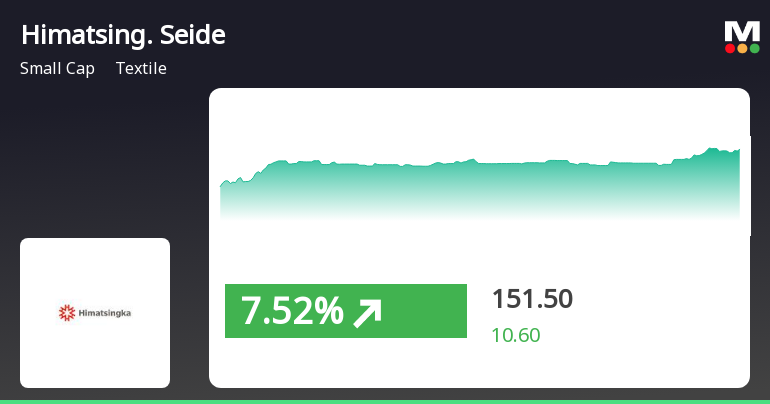
Himatsingka Seide Shows Resilience Amid Broader Market Decline and Volatility
2025-04-01 12:30:19Himatsingka Seide, a small-cap textile company, rebounded significantly on April 1, 2025, after five days of decline, outperforming its sector. The stock is currently above its short-term moving averages and has shown strong monthly growth, contrasting with the broader market's downturn.
Read MoreHimatsingka Seide Faces Bearish Technical Trends Amid Market Volatility
2025-03-26 08:01:04Himatsingka Seide, a small-cap player in the textile industry, has recently undergone an evaluation revision reflecting its current market dynamics. The stock is currently priced at 147.50, down from a previous close of 152.65, with a 52-week high of 231.60 and a low of 107.50. Today's trading saw a high of 153.90 and a low of 146.10, indicating some volatility in its performance. The technical summary for Himatsingka Seide reveals a bearish sentiment across various indicators. The MACD shows a bearish trend on a weekly basis, while the monthly outlook is mildly bearish. Similarly, Bollinger Bands and moving averages also reflect bearish tendencies. The KST indicator aligns with this sentiment, indicating a bearish trend on a weekly basis and a mildly bearish stance monthly. In terms of performance, Himatsingka Seide's stock return over the past week has been negative at -1.99%, contrasting sharply with t...
Read MoreHimatsingka Seide Experiences Technical Trend Shifts Amid Market Volatility
2025-03-24 08:00:32Himatsingka Seide, a small-cap player in the textile industry, has recently undergone an evaluation revision reflecting its current market dynamics. The stock, which closed at 155.15, has shown notable fluctuations, with a 52-week high of 231.60 and a low of 107.50. Today's trading saw a high of 155.90 and a low of 148.60, indicating some volatility in its price movements. The technical summary reveals a mixed outlook across various indicators. The MACD shows bearish tendencies on a weekly basis while leaning mildly bearish on a monthly scale. The Relative Strength Index (RSI) currently presents no signals for both weekly and monthly assessments. Bollinger Bands indicate a mildly bearish trend weekly, contrasting with a bullish stance monthly. Moving averages also reflect a mildly bearish sentiment on a daily basis. In terms of performance, Himatsingka Seide has outperformed the Sensex over the past week ...
Read MoreHimatsingka Seide Faces Technical Trend Shifts Amidst Market Evaluation Adjustments
2025-03-21 08:00:33Himatsingka Seide, a small-cap player in the textile industry, has recently undergone an evaluation revision reflecting its current market dynamics. The stock is currently priced at 148.50, slightly down from the previous close of 148.80. Over the past year, Himatsingka Seide has shown a return of 24.06%, significantly outperforming the Sensex, which recorded a return of 5.89% in the same period. In terms of technical indicators, the weekly MACD and KST are signaling bearish trends, while the monthly indicators show a mildly bearish stance. The Bollinger Bands and moving averages also reflect a bearish sentiment on a daily basis. Notably, the stock's performance over various time frames reveals a mixed picture; while it has struggled year-to-date with a return of -21.05%, it has shown resilience over the last five years with a return of 139.52%, albeit trailing behind the Sensex's 155.21%. The recent eval...
Read MoreHimatsingka Seide's Technical Indicators Signal Mixed Trends Amid Market Volatility
2025-03-19 08:01:03Himatsingka Seide, a small-cap player in the textile industry, has recently undergone an evaluation revision reflecting its current market dynamics. The company's stock price has shown fluctuations, closing at 150.50, up from the previous close of 147.50. Over the past week, the stock has experienced a notable high of 152.40 and a low of 147.50, indicating some volatility. In terms of technical indicators, the MACD suggests a bearish trend on a weekly basis while showing bullish tendencies monthly. The Relative Strength Index (RSI) currently indicates no signal for both weekly and monthly assessments. Bollinger Bands reflect a mildly bearish stance weekly, with a sideways trend monthly. Moving averages are bearish on a daily basis, while the KST shows a bearish trend weekly and mildly bearish monthly. When comparing the company's performance to the Sensex, Himatsingka Seide has demonstrated a strong retur...
Read MoreHimatsingka Seide Faces Technical Trend Challenges Amid Market Volatility
2025-03-13 08:00:40Himatsingka Seide, a small-cap player in the textile industry, has recently undergone an evaluation revision reflecting its current market dynamics. The stock is currently priced at 145.10, showing a notable increase from the previous close of 132.55. Over the past year, the stock has reached a high of 231.60 and a low of 107.50, indicating significant volatility. In terms of technical indicators, the weekly MACD and KST are positioned in a bearish trend, while the monthly indicators show a mildly bearish stance. The Bollinger Bands and moving averages also reflect bearish tendencies on a daily basis. The Dow Theory presents a mixed view, with a mildly bullish signal on the weekly chart but a bearish outlook monthly. When comparing the stock's performance to the Sensex, Himatsingka Seide has shown a 15.62% return over the past week, significantly outperforming the Sensex, which returned only 0.41% in the ...
Read MoreHimatsingka Seide's Stock Activity Highlights Divergence from Broader Market Trends
2025-03-12 18:00:16Himatsingka Seide Ltd, a small-cap player in the textile industry, has shown significant activity today, with its stock rising by 9.47%. This performance stands in contrast to the broader market, as the Sensex experienced a slight decline of 0.10%. Over the past week, Himatsingka Seide has outperformed the Sensex, gaining 15.62% compared to the index's modest increase of 0.41%. Despite the recent uptick, the company's year-to-date performance remains negative at -22.86%, while the Sensex has declined by 5.26% during the same period. Over the last year, Himatsingka Seide has achieved a return of 12.70%, significantly outperforming the Sensex's 0.49% gain. The company's market capitalization stands at Rs 1,707.00 crore, with a price-to-earnings (P/E) ratio of 20.77, which is lower than the industry average of 28.62. Technical indicators suggest a mixed outlook, with weekly metrics showing bearish trends, wh...
Read MoreClosure of Trading Window
28-Mar-2025 | Source : BSEThe trading window for dealing in the Companys equity shares shall remain closed from Tuesday April 01 2025 till the completion of 48 hours after declaration of the Audited Financials Results for the quarter and year ended March 31 2025.
Announcement under Regulation 30 (LODR)-Earnings Call Transcript
18-Feb-2025 | Source : BSEWe enclose herewith a copy of transcript of the earnings call for Analysts and Investors held on Thursday February 13 2025.
Ongoing Litigation(S) Or Dispute(S) And Updates
13-Feb-2025 | Source : BSEWe enclose herewith details of Ongoing litigation(s) and updates
Corporate Actions

No Upcoming Board Meetings

Himatsingka Seide Ltd has declared 5% dividend, ex-date: 20 Sep 24

No Splits history available

No Bonus history available

No Rights history available


