
Kama Holdings Shows Mixed Technical Trends Amidst Market Volatility
2025-03-20 08:02:46Kama Holdings, a midcap player in the Finance/NBFC sector, has recently undergone an evaluation revision reflecting its current market dynamics. The stock is currently priced at 2,646.80, showing a notable increase from the previous close of 2,517.65. Over the past week, the stock reached a high of 2,675.00 and a low of 2,500.05, indicating some volatility. In terms of technical indicators, the weekly MACD suggests a mildly bullish sentiment, while the monthly perspective leans towards a mildly bearish outlook. The Bollinger Bands indicate a bullish trend on a weekly basis, contrasting with a mildly bearish stance monthly. Moving averages also reflect a mildly bearish trend on a daily basis, while the KST shows mixed signals with a mildly bullish weekly reading and a mildly bearish monthly one. Kama Holdings has demonstrated strong performance relative to the Sensex, particularly over longer periods. In t...
Read MoreKama Holdings Adjusts Valuation Amidst Competitive Finance Sector Landscape
2025-03-20 08:00:49Kama Holdings, a midcap player in the finance and non-banking financial company (NBFC) sector, has recently undergone a valuation adjustment. The company's current price stands at 2,646.80, reflecting a notable increase from the previous close of 2,517.65. Over the past year, Kama Holdings has demonstrated a stock return of 6.78%, while the Sensex has returned 4.77% in the same period, indicating a relative outperformance. Key financial metrics for Kama Holdings include a price-to-earnings (PE) ratio of 10.94 and an EV to EBITDA ratio of 4.98. The company's return on capital employed (ROCE) is reported at 16.01%, and return on equity (ROE) is at 11.05%. These figures suggest a solid operational performance within its industry. In comparison to its peers, Kama Holdings maintains a competitive position, with its valuation metrics generally aligning with those of other companies in the sector. For instance, ...
Read More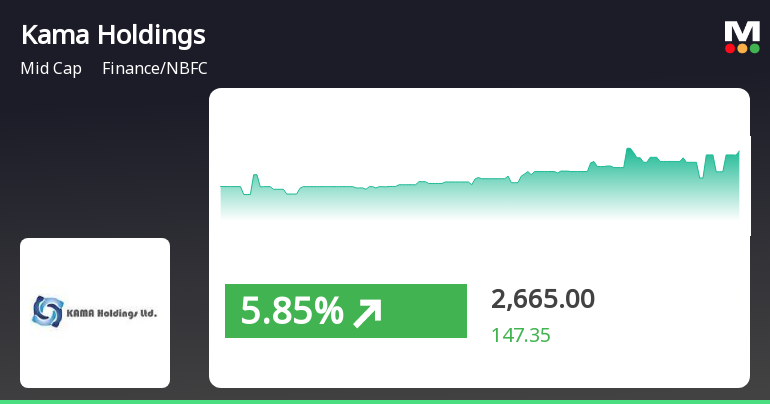
Kama Holdings Outperforms Sector Amid Broader Market Gains and Small-Cap Strength
2025-03-19 12:05:23Kama Holdings has demonstrated strong performance, gaining 5.26% on March 19, 2025, and outperforming its sector. The stock has consistently risen over three days, reaching an intraday high of Rs 2675. Year-to-date, it has increased by 8.52%, contrasting with the Sensex's decline.
Read MoreKama Holdings Adjusts Valuation Grade, Highlighting Competitive Strength in Finance Sector
2025-03-10 08:00:43Kama Holdings, a midcap player in the finance and non-banking financial company (NBFC) sector, has recently undergone a valuation adjustment. The company's financial metrics reflect a price-to-earnings (P/E) ratio of 10.06 and an enterprise value to EBITDA ratio of 4.73, indicating a competitive position within its industry. Additionally, Kama Holdings boasts a return on capital employed (ROCE) of 16.01% and a return on equity (ROE) of 11.05%, showcasing its operational efficiency and profitability. In comparison to its peers, Kama Holdings presents a more favorable valuation profile. For instance, while Nuvama Wealth and KFin Technologies are positioned at significantly higher P/E ratios, Kama's metrics suggest a more attractive investment proposition. Other competitors, such as Angel One and Aadhar Housing Finance, also reflect varying valuation levels, with Kama Holdings maintaining a competitive edge i...
Read MoreKama Holdings Faces Bearish Technical Trends Amid Market Volatility and Mixed Signals
2025-03-03 08:00:53Kama Holdings, a midcap player in the Finance/NBFC sector, has recently undergone an evaluation revision reflecting its current market dynamics. The stock is currently priced at 2,421.45, down from a previous close of 2,472.90, with a 52-week high of 3,098.00 and a low of 2,349.00. Today's trading saw a high of 2,488.95 and a low of 2,406.10, indicating some volatility in its performance. The technical summary for Kama Holdings reveals a bearish sentiment across various indicators. The MACD shows a bearish trend on a weekly basis, while the monthly perspective is mildly bearish. Bollinger Bands also reflect a bearish outlook, and moving averages indicate a bearish trend on a daily basis. The KST presents a mildly bullish signal weekly but shifts to mildly bearish monthly, suggesting mixed signals in the short term. In terms of returns, Kama Holdings has shown varied performance compared to the Sensex. Ove...
Read MoreKama Holdings Faces Technical Trend Shifts Amid Market Evaluation Revision
2025-03-02 08:00:52Kama Holdings, a midcap player in the Finance/NBFC sector, has recently undergone an evaluation revision reflecting its current market dynamics. The stock is currently priced at 2,421.45, down from a previous close of 2,472.90. Over the past year, the stock has experienced a decline of 5.43%, contrasting with a modest gain of 1.24% in the Sensex during the same period. In terms of technical indicators, the weekly MACD and Bollinger Bands signal bearish trends, while the monthly metrics show a mildly bearish stance. The daily moving averages also reflect a bearish outlook. Notably, the KST presents a mildly bullish trend on a weekly basis but shifts to mildly bearish on a monthly scale. Despite the recent challenges, Kama Holdings has shown resilience over longer periods, with a remarkable 1,251.63% return over the past decade, significantly outperforming the Sensex's 149.30% return. This long-term perfo...
Read MoreKama Holdings Faces Technical Trend Shifts Amid Market Evaluation Revision
2025-03-01 08:00:51Kama Holdings, a midcap player in the Finance/NBFC sector, has recently undergone an evaluation revision reflecting its current market dynamics. The stock is currently priced at 2,421.45, down from a previous close of 2,472.90. Over the past year, the stock has experienced a decline of 5.43%, contrasting with a modest gain of 1.24% in the Sensex during the same period. In terms of technical indicators, the weekly MACD and Bollinger Bands suggest a bearish sentiment, while the monthly MACD shows a mildly bearish trend. The Relative Strength Index (RSI) indicates no significant signals on both weekly and monthly charts. Moving averages also reflect a bearish outlook on a daily basis. Despite the recent challenges, Kama Holdings has shown resilience over longer periods, with a notable return of 133.02% over the past five years, significantly outperforming the Sensex's 91.13% return in the same timeframe. T...
Read More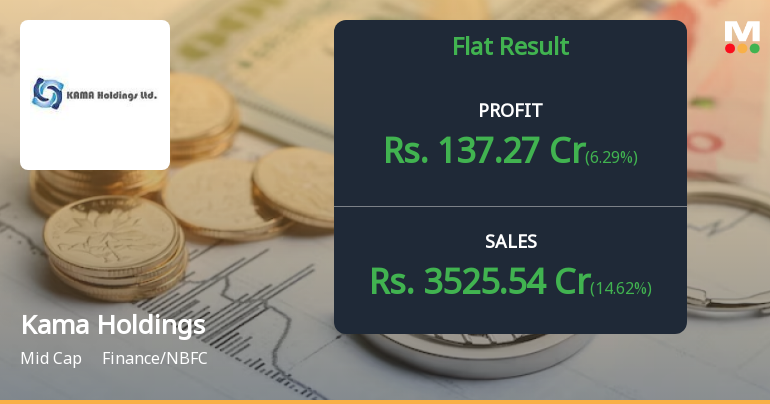
Kama Holdings Reports Steady Financial Performance and Improved Evaluation Metrics in December 2024
2025-02-14 15:02:43Kama Holdings has announced its financial results for the quarter ending December 2024, revealing steady performance. An evaluation adjustment indicates a shift in underlying metrics, providing insights into the company's operational dynamics and market positioning within the finance sector, which stakeholders may find valuable to monitor.
Read More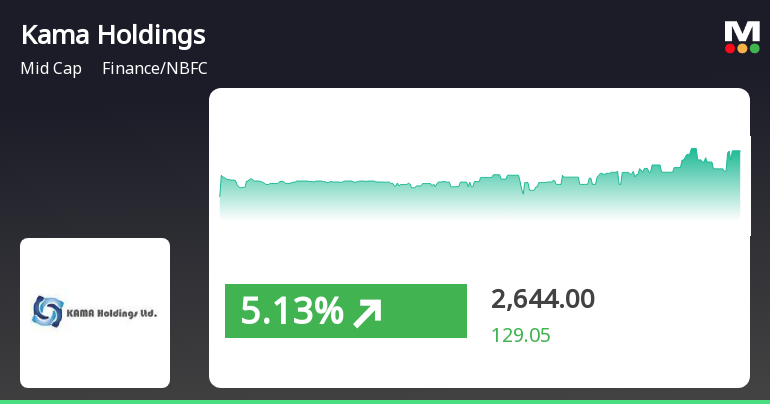
Kama Holdings Shows Strong Performance Amidst Broader Market Fluctuations
2025-01-30 15:50:19Kama Holdings, a midcap finance and NBFC company, experienced notable trading activity on January 30, 2025, outperforming both its sector and the broader market. The stock has shown a consistent upward trend over the past three days and is trading above multiple moving averages, indicating strong performance.
Read MoreClosure of Trading Window
31-Mar-2025 | Source : BSEIntimation regarding closure of Trading Window
Tax Deducted At Source (TDS) On Dividend
25-Mar-2025 | Source : BSETax Deducted at Source (TDS) on Dividend
Board Meeting Outcome for Declaration Of Second Interim Dividend-2024-25
24-Mar-2025 | Source : BSEWe wish to inform you that the Board of Directors at its meeting held today has declared interim dividend @ 177.50% i.e. Rs. 17.75 per share on the paid-up equity share capital of the Company. Dividend would be paid to members whose names appear on the Register of Members and the beneficial owners as per details received from National Securities Depository Limited and Central Depository Services (India) Limited as on the Record Date i.e. Friday 28th March 2025 which has already been communicated to Exchanges by letter dated 17th March 2025. The date of payment of interim equity dividend will be Tuesday the 22nd April 2025. The meeting commenced at 11:00 am and concluded at 11: 35 am
Corporate Actions

No Upcoming Board Meetings

Kama Holdings Ltd has declared 177% dividend, ex-date: 28 Mar 25

No Splits history available

Kama Holdings Ltd has announced 4:1 bonus issue, ex-date: 17 Oct 23

No Rights history available


