
Onward Technologies Faces Mixed Technical Signals Amidst Market Challenges
2025-04-02 08:04:21Onward Technologies, a microcap player in the IT software industry, has recently undergone an evaluation revision reflecting its current market dynamics. The stock, priced at 258.30, has shown fluctuations with a previous close of 250.10 and a daily range between 252.05 and 261.35. Over the past year, Onward Technologies has faced significant challenges, with a stock return of -44.54%, contrasting sharply with a modest gain of 2.72% in the Sensex during the same period. The technical summary indicates mixed signals across various indicators. The MACD shows a mildly bullish trend on a weekly basis, while the monthly perspective remains bearish. The Relative Strength Index (RSI) presents no signal weekly but is bullish monthly, suggesting some underlying strength. Bollinger Bands and moving averages indicate a bearish sentiment, particularly on a daily basis. In terms of performance, Onward Technologies ha...
Read More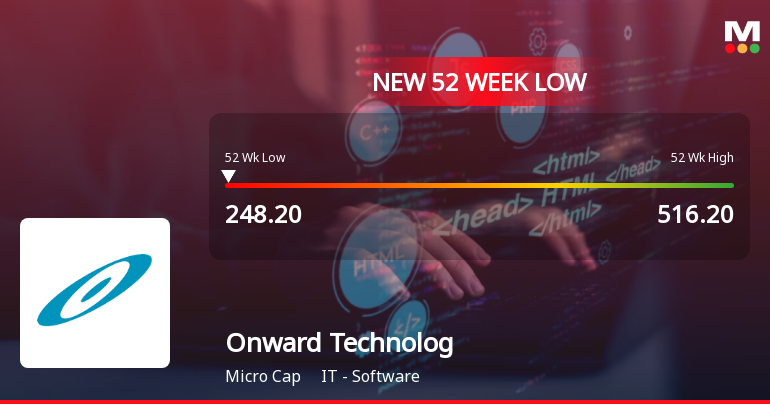
Onward Technologies Hits 52-Week Low Amid Broader IT Sector Decline
2025-03-12 12:06:24Onward Technologies, an IT software microcap, reached a new 52-week low, continuing a three-day decline. The stock is trading below key moving averages and has seen a significant one-year drop. Financially, the company faces reduced sales growth and profit, alongside decreased institutional investor participation.
Read MoreOnward Technologies Faces Mixed Technical Trends Amid Recent Market Volatility
2025-03-11 08:02:09Onward Technologies, a microcap player in the IT software industry, has recently undergone an evaluation revision reflecting its current market dynamics. The stock is currently priced at 261.00, down from a previous close of 271.70, with a notable 52-week high of 516.20 and a low of 250.00. Today's trading saw a high of 294.95 and a low of 261.00, indicating some volatility. The technical summary reveals a mixed picture. The MACD indicates a mildly bullish trend on a weekly basis but shifts to bearish on a monthly scale. The Relative Strength Index (RSI) shows no signal weekly, while it is bullish monthly. Bollinger Bands and KST both reflect bearish trends across both weekly and monthly evaluations. Daily moving averages also suggest a bearish outlook. In terms of performance, Onward Technologies has faced challenges compared to the Sensex. Over the past week, the stock has returned -7.10%, while the Sen...
Read MoreCompliances-Certificate under Reg. 74 (5) of SEBI (DP) Regulations 2018
09-Apr-2025 | Source : BSECompliance Certificate under Reg 74(5) of SEBI (DP) Regulations 2018
Closure of Trading Window
25-Mar-2025 | Source : BSEClosure of Trading Window
Announcement under Regulation 30 (LODR)-Allotment of ESOP / ESPS
21-Mar-2025 | Source : BSEIntimation for allotment of Equity Shares pursuant to exercise of options under ESOP Scheme 2019
Corporate Actions

No Upcoming Board Meetings

Onward Technologies Ltd has declared 50% dividend, ex-date: 12 Jul 24

No Splits history available

No Bonus history available

No Rights history available


