
Sapphire Foods Faces Mixed Technical Trends Amidst Market Performance Challenges
2025-04-03 08:06:26Sapphire Foods India, a midcap player in the lifestyle industry, has recently undergone an evaluation revision reflecting its current market dynamics. The stock is currently priced at 297.40, showing a slight increase from the previous close of 293.30. Over the past year, Sapphire Foods has experienced a decline of 4.52%, contrasting with a 3.67% gain in the Sensex, highlighting a challenging performance relative to the broader market. The technical summary indicates a mixed outlook, with the MACD showing bearish signals on a weekly basis and mildly bearish on a monthly basis. The Relative Strength Index (RSI) presents no signal weekly but is bullish monthly, suggesting some underlying strength. Bollinger Bands also reflect a mildly bearish trend, while moving averages indicate a bearish stance on a daily basis. In terms of returns, Sapphire Foods has faced a notable decline of 11.22% year-to-date, while ...
Read MoreSapphire Foods Faces Bearish Technical Trends Amid Market Challenges
2025-03-26 08:05:00Sapphire Foods India, a midcap player in the lifestyle industry, has recently undergone an evaluation revision reflecting its current market dynamics. The stock is currently priced at 300.80, down from a previous close of 307.35, with a 52-week high of 400.50 and a low of 259.20. Today's trading saw a high of 310.10 and a low of 294.55. The technical summary indicates a bearish sentiment across various indicators. The MACD shows a bearish trend on a weekly basis, while the monthly outlook is mildly bearish. Bollinger Bands also reflect a bearish stance for both weekly and monthly assessments. Moving averages on a daily basis align with this bearish trend, while the KST presents a bullish signal on a weekly basis, indicating some mixed signals in the short term. In terms of performance, Sapphire Foods has faced challenges compared to the Sensex. Over the past week, the stock has returned -2.83%, while the ...
Read MoreSapphire Foods Faces Mixed Technical Trends Amid Market Volatility and Competitive Pressures
2025-03-24 08:03:00Sapphire Foods India, a midcap player in the lifestyle industry, has recently undergone an evaluation revision reflecting its current market dynamics. The stock is currently priced at 311.45, showing a notable increase from the previous close of 299.00. Over the past week, the stock has experienced a high of 320.05 and a low of 299.15, indicating some volatility. In terms of technical indicators, the MACD suggests a bearish trend on a weekly basis, while the monthly outlook is mildly bearish. The Relative Strength Index (RSI) shows no signal on a weekly basis but indicates bullish momentum monthly. Bollinger Bands reflect a mildly bearish stance weekly, contrasting with a bullish monthly perspective. Moving averages indicate a bearish trend daily, while the KST shows bullish signals weekly. When comparing Sapphire Foods' performance to the Sensex, the stock has returned 2.57% over the past week, lagging b...
Read MoreSapphire Foods Faces Technical Bearish Trends Amid Market Volatility and Underperformance
2025-03-21 08:03:14Sapphire Foods India, a midcap player in the lifestyle industry, has recently undergone an evaluation revision reflecting its current market dynamics. The stock is currently priced at 299.00, down from a previous close of 306.40, with a notable 52-week high of 400.50 and a low of 259.20. Today's trading saw a high of 312.85 and a low of 298.80, indicating some volatility. The technical summary reveals a bearish sentiment across various indicators. The MACD shows a bearish trend on a weekly basis, while the monthly outlook is mildly bearish. Bollinger Bands also reflect a bearish stance for both weekly and monthly evaluations. Moving averages indicate a bearish trend on a daily basis, while the KST presents a bullish signal on a weekly basis, suggesting mixed signals in the short term. In terms of performance, Sapphire Foods has faced challenges compared to the Sensex. Over the past week, the stock has ret...
Read MoreSapphire Foods India Faces Mixed Technical Trends Amid Market Evaluation Revision
2025-03-19 08:05:08Sapphire Foods India, a midcap player in the lifestyle industry, has recently undergone an evaluation revision reflecting its current market dynamics. The stock is currently priced at 309.55, showing a notable increase from the previous close of 294.95. Over the past year, Sapphire Foods has demonstrated a return of 5.7%, outperforming the Sensex, which recorded a return of 3.51% in the same period. In terms of technical indicators, the weekly MACD remains bearish, while the monthly outlook is mildly bearish. The Relative Strength Index (RSI) shows no signal for both weekly and monthly assessments. Bollinger Bands indicate a mildly bearish trend on a weekly basis, contrasting with a mildly bullish monthly perspective. Daily moving averages reflect a bearish sentiment, while the KST shows a bullish trend on a weekly basis. When comparing the stock's performance to the Sensex, Sapphire Foods has faced chall...
Read More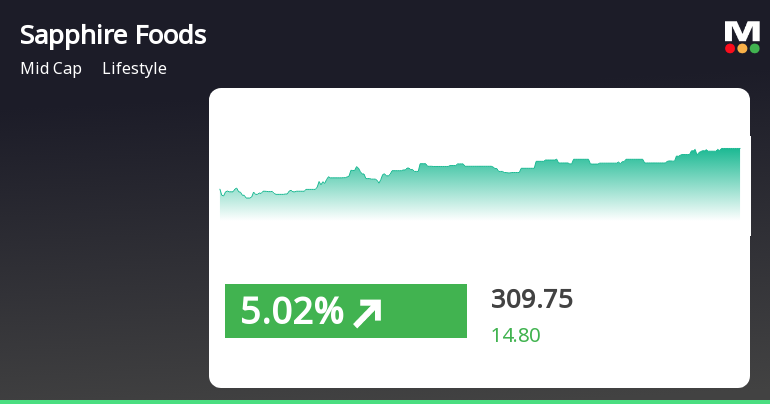
Sapphire Foods Shows Recovery Amid Broader Market Resilience and Ongoing Challenges
2025-03-18 13:50:30Sapphire Foods India saw a 5.02% increase on March 18, 2025, after three days of decline, reaching an intraday high of Rs 309.75. Despite this uptick, the stock remains below key moving averages, indicating ongoing challenges. In contrast, the Sensex rose by 1.21%, reflecting broader market resilience.
Read MoreSapphire Foods Experiences Mixed Technical Trends Amid Market Volatility
2025-03-18 08:04:41Sapphire Foods India, a midcap player in the lifestyle industry, has recently undergone an evaluation revision reflecting its current market dynamics. The stock is currently priced at 294.95, down from a previous close of 303.65, with a notable 52-week high of 400.50 and a low of 259.20. Today's trading saw a high of 309.90 and a low of 294.30, indicating some volatility. The technical summary for Sapphire Foods reveals a mixed performance across various indicators. The MACD shows bearish signals on a weekly basis, while the monthly perspective is mildly bearish. The Relative Strength Index (RSI) presents no signal weekly but indicates bullish momentum monthly. Bollinger Bands and daily moving averages reflect bearish trends, while the KST shows bullish signals weekly. In terms of stock performance relative to the Sensex, Sapphire Foods has faced challenges over the past week and year-to-date, with return...
Read MoreSapphire Foods Experiences Technical Indicator Shifts Amid Mixed Performance Metrics
2025-03-13 08:02:49Sapphire Foods India, a midcap player in the lifestyle industry, has recently undergone an evaluation revision reflecting shifts in its technical indicators. The current price stands at 316.30, down from a previous close of 328.60, with a 52-week high of 400.50 and a low of 259.20. Today's trading saw a high of 326.40 and a low of 309.00. The technical summary indicates a mixed performance across various metrics. The MACD shows bearish tendencies on a weekly basis, while the monthly perspective leans mildly bearish. The Relative Strength Index (RSI) presents no signal weekly but is bullish monthly, suggesting some divergence in momentum. Bollinger Bands reflect bearish conditions weekly and bullish monthly, indicating volatility in price movements. Daily moving averages are bearish, while the KST shows bullish signals weekly. In terms of performance, Sapphire Foods has demonstrated resilience compared to ...
Read MoreAnnouncement under Regulation 30 (LODR)-Allotment of ESOP / ESPS
07-Apr-2025 | Source : BSESapphire Foods India Limited has informed Exchange regarding allotment of 192011 Shares
Announcement under Regulation 30 (LODR)-Allotment of ESOP / ESPS
25-Mar-2025 | Source : BSESapphire Foods India Limited has informed the Exchange regarding Allotment of 250650 shares
Closure of Trading Window
24-Mar-2025 | Source : BSESapphire Foods India Limited has informed the Exchange regarding the Trading Window closure to SEBI ( Prohibition of Insider Trading ) Regulations 2015
Corporate Actions

No Upcoming Board Meetings

No Dividend history available

Sapphire Foods India Ltd has announced 2:10 stock split, ex-date: 05 Sep 24

No Bonus history available

No Rights history available


