
Skipper Adjusts Valuation Amid Strong Performance and Competitive Industry Dynamics
2025-03-24 08:00:46Skipper, a midcap player in the transmission towers industry, has recently undergone a valuation adjustment. The company's current price stands at 462.55, reflecting a notable increase from the previous close of 437.10. Over the past year, Skipper has demonstrated a strong performance with a return of 78.76%, significantly outpacing the Sensex, which returned 5.87% in the same period. Key financial metrics for Skipper include a PE ratio of 41.22 and an EV to EBITDA ratio of 13.39. The company also boasts a return on capital employed (ROCE) of 21.80% and a return on equity (ROE) of 11.55%. In comparison to its peers, Skipper's valuation metrics indicate a more favorable position relative to PTC Industries, which is categorized as very expensive, while both Kalpataru Projects and Transrail Light are assessed as fair. The evaluation revision reflects the ongoing dynamics within the industry, highlighting Ski...
Read More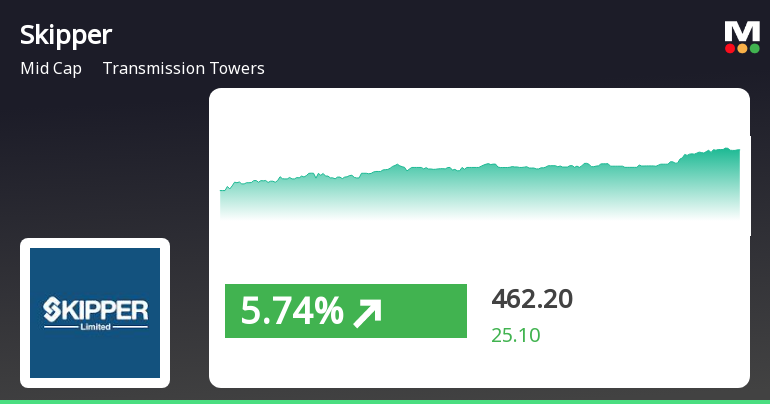
Skipper Ltd. Surges Amid Strong Market Recovery and Small-Cap Momentum
2025-03-21 12:50:17Skipper Ltd., a midcap company in the transmission towers sector, has experienced notable stock performance, gaining 5.7% on March 21, 2025. The stock has shown a strong upward trend over the past four days, with a total return of 19.78%, and has significantly outperformed the Sensex over the past year.
Read MoreSkipper's Technical Indicators Reflect Mixed Signals Amid Market Resilience
2025-03-19 08:03:51Skipper, a small-cap player in the transmission towers industry, has recently undergone an evaluation revision reflecting its current market dynamics. The stock is currently priced at 408.95, showing a notable shift from its previous close of 386.00. Over the past year, Skipper has demonstrated significant resilience, with a return of 64.67%, outperforming the Sensex, which recorded a return of 3.51% in the same period. In terms of technical indicators, the weekly MACD remains bearish, while the monthly outlook is mildly bearish. The Relative Strength Index (RSI) shows no signals on both weekly and monthly charts, indicating a neutral momentum. Bollinger Bands present a mildly bearish trend on a weekly basis, contrasting with a bullish stance on the monthly chart. Moving averages indicate a bearish trend daily, while the KST reflects a bearish position weekly and mildly bearish monthly. The company's perf...
Read MoreSkipper Experiences Technical Trend Shift Amidst Strong Long-Term Performance
2025-03-13 08:01:56Skipper, a small-cap player in the transmission towers industry, has recently undergone a technical trend adjustment. The company's current stock price stands at 397.00, reflecting a decline from the previous close of 414.35. Over the past year, Skipper has shown a notable return of 38.18%, significantly outperforming the Sensex, which recorded a mere 0.49% return in the same period. In terms of technical indicators, the weekly MACD is bearish, while the monthly MACD shows a mildly bearish stance. The Relative Strength Index (RSI) indicates a bullish trend on a weekly basis, but there is no signal on the monthly chart. Bollinger Bands present a bearish outlook weekly, contrasting with a bullish monthly perspective. Moving averages and KST also reflect bearish trends, while Dow Theory indicates a mildly bullish weekly trend. Looking at the company's performance over various time frames, Skipper has delive...
Read MoreSkipper Experiences Mixed Technical Trends Amid Market Volatility and Historical Performance
2025-03-11 08:04:03Skipper, a small-cap player in the transmission towers industry, has recently undergone an evaluation revision reflecting its current market dynamics. The stock is currently priced at 400.00, down from a previous close of 423.50, with a notable 52-week high of 665.00 and a low of 231.65. Today's trading saw a high of 433.00 and a low of 400.00, indicating some volatility. The technical summary reveals a mixed picture. The MACD indicates bearish trends on a weekly basis, while the monthly outlook is mildly bearish. The Relative Strength Index (RSI) shows bullish momentum weekly, but no significant signal monthly. Bollinger Bands present a bearish stance weekly, contrasting with a bullish monthly trend. Moving averages reflect bearish conditions daily, while the KST and OBV metrics suggest a mildly bearish trend on a monthly basis. In terms of performance, Skipper has shown varied returns compared to the Se...
Read MoreSkipper's Technical Indicators Shift Amidst Strong Long-Term Performance Trends
2025-03-10 08:01:35Skipper, a small-cap player in the transmission towers industry, has recently undergone an evaluation revision reflecting its current market dynamics. The stock is currently priced at 423.50, showing a slight increase from the previous close of 418.00. Over the past year, Skipper has demonstrated a notable return of 37.17%, significantly outperforming the Sensex, which recorded a mere 0.29% during the same period. In terms of technical indicators, the weekly MACD and KST are both signaling bearish trends, while the monthly indicators show a mildly bearish stance. The moving averages on a daily basis also reflect a bearish sentiment. The Bollinger Bands present a mixed picture, with weekly readings indicating a mildly bearish trend and monthly readings suggesting bullish conditions. Despite the recent challenges, Skipper's long-term performance remains impressive, particularly over three and five years, wh...
Read MoreSkipper Ltd. Shows Strong Long-Term Gains Amid Short-Term Market Challenges
2025-03-07 18:00:33Skipper Ltd., a small-cap player in the transmission towers industry, has shown notable activity in the stock market today, with a daily performance increase of 1.32%. This contrasts with the Sensex, which experienced a slight decline of 0.01%. Over the past year, Skipper has outperformed the Sensex significantly, boasting a return of 37.17% compared to the index's modest 0.29%. Despite its strong annual performance, Skipper's stock has faced challenges in the short term, with a year-to-date decline of 22.15%, while the Sensex has decreased by 4.87%. The company's market capitalization stands at Rs 4,767.00 crore, and it currently has a price-to-earnings (P/E) ratio of 37.74, which is lower than the industry average of 50.72. In terms of longer-term performance, Skipper has delivered impressive returns over three and five years, with gains of 632.91% and 1342.64%, respectively. However, recent technical i...
Read MoreSkipper's Technical Indicators Reflect Mixed Trends Amid Strong Long-Term Performance
2025-03-06 08:02:12Skipper, a small-cap player in the transmission towers industry, has recently undergone an evaluation revision reflecting its current market dynamics. The stock is currently priced at 412.25, showing a notable increase from the previous close of 397.70. Over the past year, Skipper has demonstrated a strong performance with a return of 30.75%, significantly outpacing the Sensex, which recorded a mere 0.07% return in the same period. In terms of technical indicators, the weekly MACD and KST are signaling bearish trends, while the monthly metrics show a mildly bearish stance. The Bollinger Bands present a mixed picture, with weekly indicators leaning mildly bearish and monthly indicators suggesting bullish momentum. The daily moving averages indicate a mildly bullish trend, providing a nuanced view of the stock's performance. When comparing returns, Skipper has shown remarkable growth over longer periods, wi...
Read MoreCompliances-Certificate under Reg. 74 (5) of SEBI (DP) Regulations 2018
09-Apr-2025 | Source : BSEWe are enclosing Certificate under Regulation 74(5)of SEBI (DP) Regulation
Disclosure Under SEBI Takeover Regulations
03-Apr-2025 | Source : BSEThe Promoters of the company has declared that they jointly held 75080657 shares of the company and they have not made any encumbrance of shares.
Intimation Of Receipt Of Cautionary Letter From BSE & NSE Under SEBI (Listing Obligations And Disclosure Requirements) Regulations 2015
29-Mar-2025 | Source : BSEWe are enclosing cautionary letter from BSE & NSE.
Corporate Actions

No Upcoming Board Meetings

Skipper Ltd. has declared 10% dividend, ex-date: 12 Sep 24

No Splits history available

No Bonus history available

Skipper Ltd. has announced 1:10 rights issue, ex-date: 12 Jan 24


