
Sundaram Clayton Shows Mixed Technical Trends Amid Strong Yearly Performance
2025-04-02 08:10:40Sundaram Clayton, a small-cap player in the castings and forgings industry, has recently undergone an evaluation revision reflecting its current market dynamics. The stock is currently priced at 2,192.80, slightly down from the previous close of 2,205.00. Over the past year, Sundaram Clayton has demonstrated a notable performance, with a return of 53.31%, significantly outpacing the Sensex's return of 2.72% during the same period. In terms of technical indicators, the stock's MACD shows a mildly bearish trend on a weekly basis, while moving averages indicate a mildly bullish stance on a daily timeframe. The Bollinger Bands and KST metrics suggest bearish tendencies, highlighting some volatility in the stock's performance. Notably, the stock has experienced a 52-week high of 2,933.00 and a low of 1,395.00, indicating a wide trading range. In the recent comparison with the Sensex, Sundaram Clayton has shown...
Read More
Sundaram Clayton Faces Mixed Financial Signals Amid Changing Market Sentiment
2025-03-25 08:26:22Sundaram Clayton, a small-cap player in the castings and forgings sector, has experienced a recent evaluation adjustment reflecting changes in market sentiment. While the company reported a significant increase in net sales, long-term fundamentals show challenges, including declining operating profits and a high Debt to EBITDA ratio.
Read MoreSundaram Clayton Faces Technical Trend Shifts Amid Market Sentiment Changes
2025-03-25 08:06:39Sundaram Clayton, a small-cap player in the castings and forgings industry, has recently undergone an evaluation revision reflecting its current market dynamics. The stock is currently priced at 2245.05, having seen fluctuations with a previous close of 2282.00. Over the past year, Sundaram Clayton has demonstrated a notable return of 65.33%, significantly outperforming the Sensex, which recorded a return of 7.07% in the same period. In terms of technical indicators, the stock's weekly MACD is categorized as mildly bearish, while the daily moving averages suggest a mildly bullish stance. The Bollinger Bands indicate a bearish trend on a weekly basis, and the KST also reflects a bearish outlook. Notably, the stock has experienced a 52-week high of 2,933.00 and a low of 1,345.00, showcasing its volatility. When comparing the stock's performance to the Sensex, it has shown resilience over the past week with ...
Read More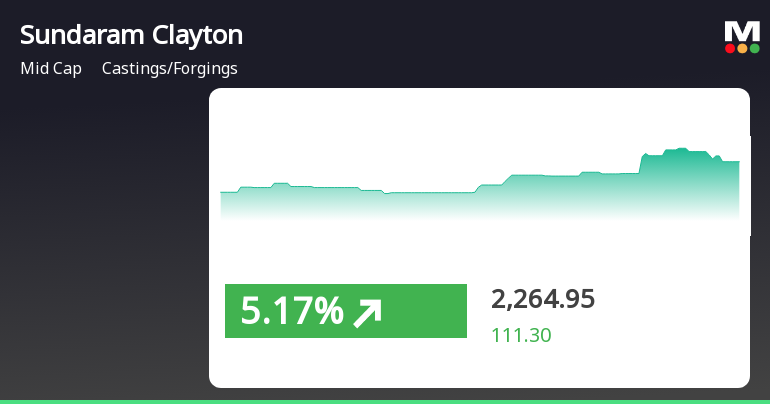
Sundaram Clayton Shows Resilience with Strong Performance Amid Market Gains
2025-03-20 11:50:27Sundaram Clayton, a midcap player in the Castings/Forgings industry, has shown strong performance, gaining 6.05% on March 20, 2025. The stock has outperformed its sector and accumulated a total return of 10.02% over four days, reflecting resilience with a 73.55% increase over the past year.
Read MoreSundaram Clayton Shows Mixed Technical Trends Amid Strong Yearly Performance
2025-03-18 08:04:52Sundaram Clayton, a small-cap player in the castings and forgings industry, has recently undergone an evaluation revision reflecting its current market dynamics. The stock is currently priced at 2118.95, showing a slight increase from the previous close of 2076.05. Over the past year, Sundaram Clayton has demonstrated a notable return of 67.3%, significantly outperforming the Sensex, which recorded a return of just 2.10% during the same period. In terms of technical indicators, the weekly MACD and Bollinger Bands suggest a mildly bearish sentiment, while the daily moving averages indicate a mildly bullish trend. The KST and OBV metrics also reflect a mixed outlook, with the weekly KST showing a mildly bearish stance and the OBV indicating no clear trend. The RSI metrics for both weekly and monthly periods currently show no signal, suggesting a period of consolidation. Despite recent fluctuations, Sundaram...
Read MoreSundaram Clayton's Technical Indicators Reflect Mixed Market Sentiment Amid Volatility
2025-03-13 08:02:56Sundaram Clayton, a small-cap player in the castings and forgings industry, has recently undergone an evaluation revision reflecting its current market dynamics. The stock, which closed at 2,131.35, has seen fluctuations with a 52-week high of 2,933.00 and a low of 1,219.00. Today's trading session recorded a high of 2,196.45 and a low of 2,117.55, indicating some volatility. In terms of technical indicators, the MACD on a weekly basis suggests a mildly bearish sentiment, while the moving averages on a daily basis show a mildly bullish trend. The On-Balance Volume (OBV) and KST indicators also reflect a mildly bearish stance on a weekly basis. Notably, the stock's performance over various time frames reveals a significant return of 60.89% over the past year, contrasting sharply with the Sensex's modest gain of 0.49% during the same period. However, the stock has faced challenges in the shorter term, with a...
Read More
Sundaram Clayton Reports Strong Sales Growth Amidst Financial Challenges and Debt Concerns
2025-03-12 08:11:11Sundaram Clayton, a small-cap player in the castings and forgings sector, recently reported a strong financial performance for Q3 FY24-25, with net sales of Rs 1,091.95 crore, reflecting a 28.84% growth. However, the company faces challenges, including declining operating profits and a high Debt to EBITDA ratio.
Read MoreSundaram Clayton Shows Mixed Technical Trends Amid Market Fluctuations and Consolidation
2025-03-12 08:03:34Sundaram Clayton, a small-cap player in the castings and forgings industry, has recently undergone an evaluation revision reflecting its current market dynamics. The stock is currently priced at 2,186.00, showing a notable increase from the previous close of 2,132.95. Over the past week, the stock has experienced fluctuations, reaching a high of 2,255.50 and a low of 2,132.95. In terms of technical indicators, the MACD on a weekly basis indicates a mildly bearish sentiment, while the daily moving averages suggest a mildly bullish outlook. The Relative Strength Index (RSI) shows no significant signals on both weekly and monthly charts, indicating a period of consolidation. Additionally, the Bollinger Bands and KST metrics also reflect a mildly bearish trend on a weekly basis. When comparing the stock's performance to the Sensex, Sundaram Clayton has faced challenges in the short term, with a 1-week return ...
Read MoreCompliances-Certificate under Reg. 74 (5) of SEBI (DP) Regulations 2018
08-Apr-2025 | Source : BSECertificate under Regulation 74(5) of SEBI (Depository and Participants) Regulations 2018 for the quarter ended 31st March 2025
Closure of Trading Window
28-Mar-2025 | Source : BSEIntimation of closure of trading window
Announcement under Regulation 30 (LODR)-Diversification / Disinvestment
27-Mar-2025 | Source : BSEDisclosure under Regulation 30 of the SEBI LODR.
Corporate Actions

No Upcoming Board Meetings

Sundaram Clayton Ltd has declared 95% dividend, ex-date: 27 Mar 25

No Splits history available

No Bonus history available

No Rights history available


