

Va Tech Wabag Adjusts Valuation Amid Profit Decline and Market Sentiment Shift
2025-04-02 08:29:01Va Tech Wabag has recently adjusted its evaluation, reflecting changes in financial metrics and market position. Key indicators include a price-to-earnings ratio of 32.86 and a return on capital employed of 21.70%. Despite a strong historical performance, the company has faced profit declines and shifting market sentiment.
Read MoreVa Tech Wabag Experiences Valuation Grade Change Amid Strong Yearly Stock Performance
2025-04-02 08:02:11Va Tech Wabag, a midcap player in the capital goods sector, has recently undergone a valuation adjustment. The company's current price stands at 1,416.90, reflecting a decline from the previous close of 1,459.50. Over the past year, Va Tech Wabag has demonstrated a notable stock return of 82.48%, significantly outperforming the Sensex, which recorded a return of 2.72% during the same period. Key financial metrics for Va Tech Wabag include a PE ratio of 32.86 and an EV to EBITDA ratio of 22.01. The company's return on capital employed (ROCE) is reported at 21.70%, while the return on equity (ROE) stands at 13.27%. These figures indicate a solid operational performance relative to its peers. In comparison, other companies in the industry exhibit varying valuation metrics. For instance, Afcons Infrastructure shows a higher PE ratio of 39.02, while NCC presents a more attractive valuation with a PE of 16.19. ...
Read MoreVa Tech Wabag Shows Mixed Technical Trends Amid Strong Long-Term Performance
2025-03-27 08:03:08Va Tech Wabag, a midcap player in the capital goods sector, has recently undergone an evaluation revision reflecting its current market dynamics. The stock is currently priced at 1,466.00, slightly down from the previous close of 1,486.50. Over the past year, the stock has demonstrated significant resilience, achieving a remarkable return of 99.20%, compared to the Sensex's 6.65% during the same period. In terms of technical indicators, the weekly MACD is bearish, while the monthly outlook shows a mildly bearish trend. The Relative Strength Index (RSI) indicates a bullish stance on a weekly basis, but no clear signal on a monthly basis. Bollinger Bands present a bearish trend weekly, contrasting with a bullish monthly perspective. Moving averages suggest a mildly bearish sentiment on a daily basis, while the KST reflects a bearish trend weekly and a bullish trend monthly. Notably, Va Tech Wabag has outpe...
Read MoreVa Tech Wabag Shows Mixed Technical Signals Amid Strong Long-Term Performance
2025-03-26 08:04:00Va Tech Wabag, a midcap player in the capital goods sector, has recently undergone an evaluation revision reflecting its current market dynamics. The stock is currently priced at 1,486.50, down from a previous close of 1,566.45, with a notable 52-week high of 1,943.95 and a low of 710.50. Today's trading saw a high of 1,579.80 and a low of 1,476.90. The technical summary indicates mixed signals across various indicators. The MACD shows a bearish trend on a weekly basis while remaining bullish monthly. The Relative Strength Index (RSI) is bullish weekly but shows no signal monthly. Bollinger Bands reflect a bearish stance weekly and bullish monthly, while moving averages indicate a mildly bearish trend daily. The KST is bearish weekly but bullish monthly, and Dow Theory suggests a mildly bullish outlook on both weekly and monthly bases. The On-Balance Volume (OBV) is mildly bullish weekly with no trend mont...
Read More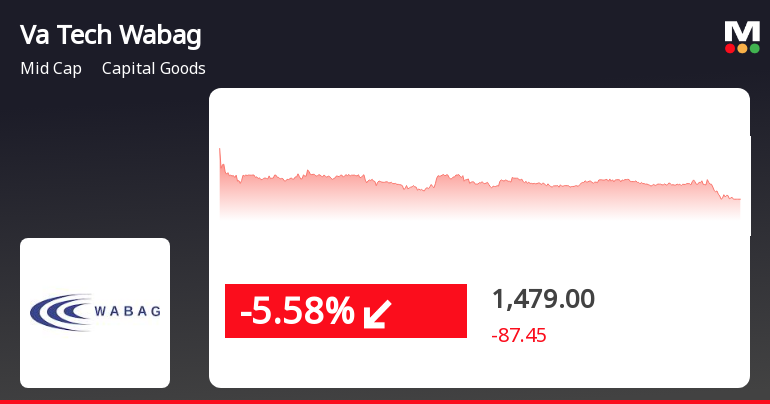
Va Tech Wabag Faces Decline Amid Strong Long-Term Performance in Capital Goods Sector
2025-03-25 15:35:24Va Tech Wabag, a midcap in the capital goods sector, saw a significant decline on March 25, 2025, following two days of gains. Despite today's drop, the stock has shown strong long-term performance, with a notable increase over the past year and three years, outpacing the Sensex.
Read More
Va Tech Wabag Faces Valuation Challenges Amid Strong Stock Performance and Profit Decline
2025-03-25 08:19:05Va Tech Wabag has recently experienced an evaluation adjustment reflecting changes in its financial metrics and market position. Despite significant returns over the past year, the company faces challenges with declining profits and high valuation metrics, while maintaining a low debt ratio and increased institutional holdings.
Read MoreVa Tech Wabag Shows Mixed Technical Trends Amid Strong Long-Term Performance
2025-03-25 08:04:55Va Tech Wabag, a midcap player in the capital goods sector, has recently undergone an evaluation revision reflecting its current market dynamics. The stock is currently priced at 1566.45, showing a notable increase from the previous close of 1515.40. Over the past year, Va Tech Wabag has demonstrated impressive performance, with a return of 112.73%, significantly outpacing the Sensex's 7.07% during the same period. The technical summary indicates a mixed outlook, with the MACD showing bearish signals on a weekly basis while being bullish on a monthly scale. The Relative Strength Index (RSI) is bullish weekly, but shows no signal monthly. Bollinger Bands reflect bullish trends for both weekly and monthly assessments. Moving averages present a mildly bearish stance daily, while the KST indicates a bearish weekly trend but a bullish monthly outlook. In terms of returns, Va Tech Wabag has excelled over longe...
Read More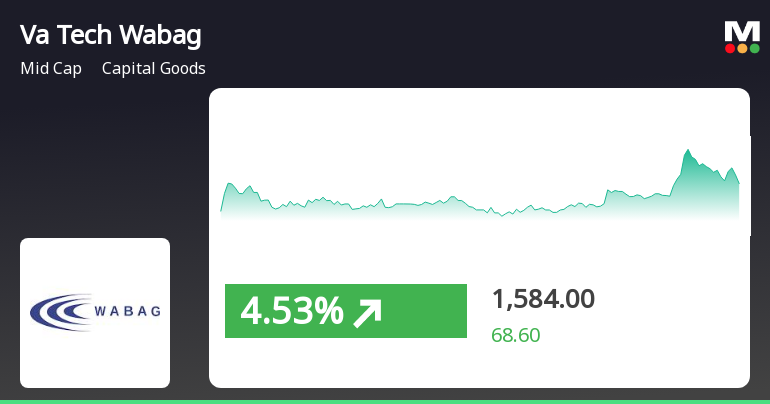
Va Tech Wabag Shows Strong Performance Amid Broader Market Gains and Small-Cap Momentum
2025-03-24 11:35:24Va Tech Wabag has demonstrated strong performance, gaining 5.54% on March 24, 2025, and achieving a total return of 15.64% over two consecutive days. The stock is trading above key moving averages and has increased 116.61% over the past year, significantly outperforming the Sensex.
Read MoreVa Tech Wabag Shows Mixed Technical Trends Amid Strong Long-Term Performance
2025-03-24 08:02:18Va Tech Wabag, a midcap player in the capital goods sector, has recently undergone an evaluation revision reflecting its current market dynamics. The stock is currently priced at 1515.40, showing a notable increase from the previous close of 1383.00. Over the past year, Va Tech Wabag has demonstrated impressive performance, with a return of 109.45%, significantly outpacing the Sensex's 5.87% return during the same period. The technical summary indicates a mixed outlook, with the MACD showing bearish signals on a weekly basis while being bullish on a monthly scale. The Relative Strength Index (RSI) is bullish weekly, but lacks a clear signal monthly. Bollinger Bands reflect a mildly bearish trend weekly, contrasting with a bullish monthly perspective. Moving averages indicate a mildly bearish stance on a daily basis, while the KST shows bearish weekly and bullish monthly trends. In terms of stock performan...
Read MoreCompliances-Certificate under Reg. 74 (5) of SEBI (DP) Regulations 2018
08-Apr-2025 | Source : BSECertificate in terms of Regulation 74(5) of the SEBI (Depositories and Participants) Regulations 2018 for the quarter ended March 31 2025
Closure of Trading Window
26-Mar-2025 | Source : BSEIntimation of Trading Window Closure
Announcement under Regulation 30 (LODR)-Earnings Call Transcript
25-Mar-2025 | Source : BSETranscript of the Analyst / Institutional Investors Call
Corporate Actions

No Upcoming Board Meetings

Va Tech Wabag Ltd has declared 200% dividend, ex-date: 01 Aug 18

Va Tech Wabag Ltd has announced 2:5 stock split, ex-date: 16 Aug 11

Va Tech Wabag Ltd has announced 1:1 bonus issue, ex-date: 26 Mar 15

No Rights history available


