
Vardhman Holdings Shows Mixed Technical Trends Amid Strong Short-Term Performance
2025-03-25 08:03:27Vardhman Holdings, a small-cap player in the Finance/NBFC sector, has recently undergone an evaluation revision reflecting its current market dynamics. The stock is currently priced at 3,673.00, showing a notable increase from the previous close of 3,308.90. Over the past week, Vardhman Holdings has demonstrated a strong performance, with a return of 21.18%, significantly outpacing the Sensex's return of 5.14% during the same period. In terms of technical indicators, the weekly MACD remains bearish, while the monthly outlook shows a mildly bearish trend. The Relative Strength Index (RSI) indicates no significant signals for both weekly and monthly assessments. Bollinger Bands present a mildly bearish trend on a weekly basis, contrasting with a bullish monthly perspective. Moving averages also reflect a mildly bearish sentiment on a daily basis. Looking at the company's performance over various time frames...
Read More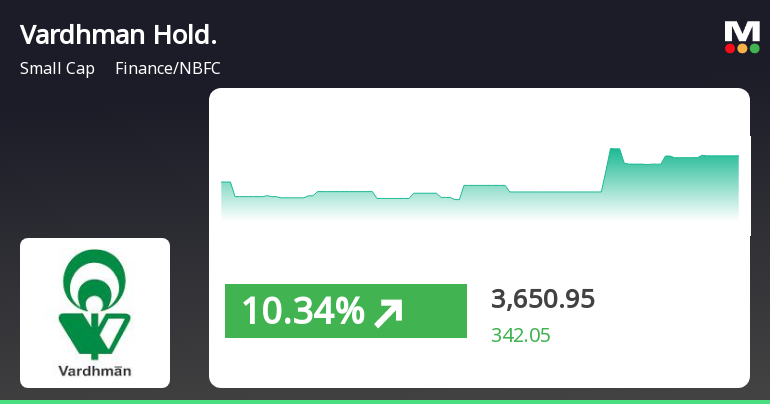
Vardhman Holdings Shows Resilience Amid Market Volatility and Small-Cap Gains
2025-03-24 11:05:15Vardhman Holdings, a small-cap finance and NBFC company, experienced notable trading activity on March 24, 2025, with significant intraday gains and volatility. The stock's performance surpassed sector averages, while the broader market, including the Sensex and BSE Small Cap index, also showed positive trends.
Read MoreVardhman Holdings Opens Strong with 5.47% Gain Amid Mixed Technical Indicators
2025-03-24 09:35:08Vardhman Holdings, a small-cap player in the finance and non-banking financial company (NBFC) sector, has shown significant activity today, opening with a gain of 5.47%. The stock reached an intraday high of Rs 3,490, outperforming its sector by 1.75%. Over the past day, Vardhman Holdings recorded a performance increase of 2.53%, compared to the Sensex's modest rise of 0.52%. In terms of longer-term performance, the stock has risen by 9.97% over the past month, significantly outpacing the Sensex, which gained 3.83% in the same period. However, technical indicators present a mixed picture. While the stock is currently above its 5-day and 20-day moving averages, it remains below the 50-day, 100-day, and 200-day moving averages. The stock is classified as high beta, with an adjusted beta of 1.35, indicating that it tends to experience larger fluctuations compared to the broader market. Technical metrics su...
Read MoreVardhman Holdings Experiences Valuation Grade Change Amid Mixed Performance Metrics
2025-03-21 08:00:25Vardhman Holdings, a small-cap player in the finance and non-banking financial company (NBFC) sector, has recently undergone a valuation adjustment. The company's financial metrics reveal a price-to-earnings (PE) ratio of 4.37 and a price-to-book value of 0.30, indicating a distinct market positioning. However, its enterprise value to EBITDA stands at a notably high 83.21, which may raise concerns about operational efficiency relative to its valuation. In terms of returns, Vardhman Holdings has shown a mixed performance against the Sensex. Over the past year, the stock has returned 20.22%, significantly outperforming the index's 5.89%. However, on a year-to-date basis, it has faced a decline of 23.90%, contrasting with the Sensex's modest drop of 2.29%. When compared to its peers, Vardhman Holdings presents a lower PE ratio than several competitors, such as Indus Inf. Trust, which is marked as very expen...
Read MoreVardhman Holdings Shows Mixed Technical Trends Amidst Market Evaluation Revision
2025-03-20 08:02:03Vardhman Holdings, a small-cap player in the Finance/NBFC sector, has recently undergone an evaluation revision reflecting its current market dynamics. The stock is currently priced at 3,222.15, showing a notable increase from the previous close of 3,091.30. Over the past week, Vardhman Holdings has demonstrated a stock return of 6.76%, significantly outperforming the Sensex, which returned 1.92% in the same period. In terms of technical indicators, the weekly MACD is bearish, while the monthly MACD shows a mildly bearish trend. The Relative Strength Index (RSI) indicates no signal for both weekly and monthly assessments. Bollinger Bands also reflect a mildly bearish stance on a weekly and monthly basis. The daily moving averages are bearish, and the KST presents a mixed picture with a bearish weekly trend and a bullish monthly trend. When examining the company's performance over various time frames, it h...
Read MoreVardhman Holdings Shows Mixed Technical Trends Amidst Market Evaluation Revision
2025-03-18 08:02:23Vardhman Holdings, a microcap player in the Finance/NBFC sector, has recently undergone an evaluation revision reflecting its current market dynamics. The stock is currently priced at 3,031.00, showing a slight increase from the previous close of 2,983.55. Over the past year, Vardhman Holdings has experienced a stock return of 5.42%, outperforming the Sensex, which recorded a return of 2.10% in the same period. In terms of technical indicators, the weekly MACD remains bearish, while the monthly perspective shows a mildly bearish trend. The Relative Strength Index (RSI) indicates bullish momentum on a weekly basis, but no significant signal on a monthly scale. Bollinger Bands reflect a mildly bearish stance for both weekly and monthly evaluations. Moving averages indicate a bearish trend on a daily basis, while the KST shows a contrasting bullish signal on a monthly basis. When comparing returns, Vardhman ...
Read More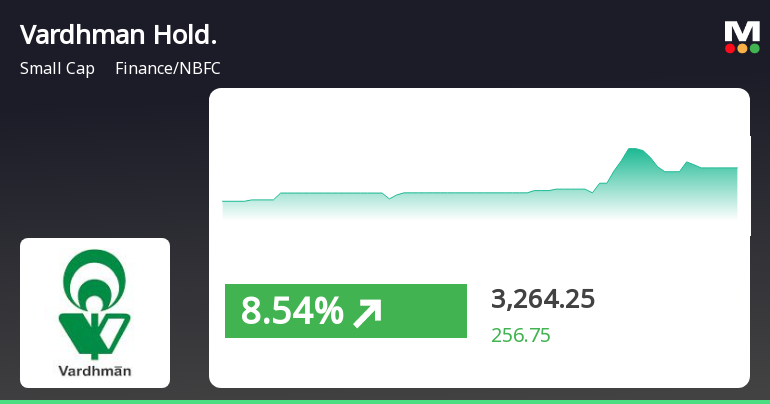
Vardhman Holdings Sees Significant Reversal Amid Mixed Market Momentum
2025-03-07 10:30:45Vardhman Holdings, a small-cap finance/NBFC company, experienced a notable performance on March 7, 2025, reversing a two-day decline. The stock showed significant intraday volatility and outperformed the broader market over the past week, although it remains down year-to-date compared to the Sensex.
Read MoreVardhman Holdings Faces Stock Volatility Amid Broader Market Trends and Declining Metrics
2025-02-21 10:29:24Vardhman Holdings Ltd, a small-cap player in the Finance/NBFC sector, has experienced notable fluctuations in its stock performance today. The company's market capitalization stands at Rs 1,030.87 crore, with a price-to-earnings (P/E) ratio of 4.32, significantly lower than the industry average of 21.07. Over the past year, Vardhman Holdings has recorded a modest gain of 1.70%, while the benchmark Sensex has risen by 3.76%. However, recent trends indicate a decline, with the stock down 1.79% today, compared to a 0.50% drop in the Sensex. The one-week performance shows a decrease of 1.43%, and the stock has faced a more substantial decline of 19.03% over the past month. Longer-term metrics reveal a year-to-date decline of 25.99%, contrasting sharply with the Sensex's 3.56% decrease. In the three-year frame, Vardhman Holdings has seen a decline of 11.13%, while the Sensex has surged by 30.63%. Despite thes...
Read More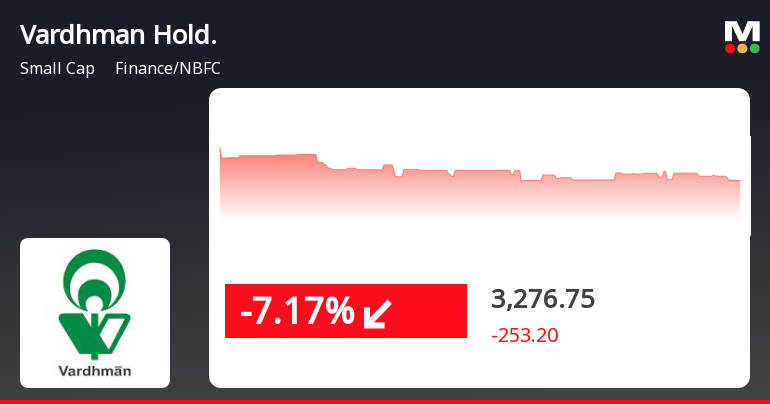
Vardhman Holdings Faces Significant Decline Amid Sector-Wide Pressures in February 2025
2025-02-14 13:15:21Vardhman Holdings, a small-cap finance company, has faced a notable decline in its stock price, dropping significantly today and reversing gains from the previous days. The stock is currently trading below multiple moving averages, indicating a bearish trend, and has experienced a substantial decline over the past month compared to the broader market.
Read MoreDemat Report For The Month Ended 31.03.2025
05-Apr-2025 | Source : BSEPlease find attached herewith Demat Report for the Month ended 31.03.2025.
Compliances-Certificate under Reg. 74 (5) of SEBI (DP) Regulations 2018
04-Apr-2025 | Source : BSEPlease find attached herewith Certificate under Regulation 74(5) of SEBI (DP) Regulations 2018.
Closure of Trading Window
27-Mar-2025 | Source : BSEPlease find attached herewith intimation regarding closure of trading window.
Corporate Actions

No Upcoming Board Meetings

Vardhman Holdings Ltd has declared 50% dividend, ex-date: 06 Sep 24

No Splits history available

No Bonus history available

No Rights history available


