
Keystone Realtors Faces Significant Decline Amid Broader Market Gains and Bearish Trends
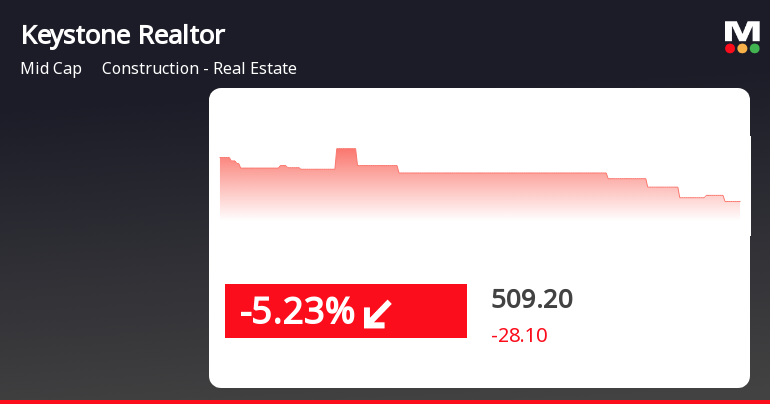
2025-04-02 14:50:25Keystone Realtors, a midcap construction and real estate firm, saw a notable decline on April 2, 2025, closing at Rs 509.2, just above its 52-week low. The stock is trading below key moving averages and has faced significant declines over the past three months and year, contrasting with broader market gains.
Read MoreKeystone Realtors Adjusts Valuation Amidst Challenging Market Performance and Competitive Landscape
2025-04-01 08:00:50Keystone Realtors, a midcap player in the construction and real estate sector, has recently undergone a valuation adjustment. The company's current price stands at 527.70, reflecting a slight decline from the previous close of 534.30. Over the past year, Keystone has experienced a stock return of -12.71%, contrasting with a 5.11% return from the Sensex, indicating a challenging performance relative to the broader market. Key financial metrics for Keystone include a PE ratio of 48.25 and an EV to EBITDA ratio of 30.42, which suggest a premium valuation compared to some peers. Notably, while Keystone's PEG ratio is at 0.00, indicating no growth expectations factored into its valuation, its return on capital employed (ROCE) is recorded at 6.67%, and return on equity (ROE) is at 5.71%. In comparison to its peers, Keystone's valuation metrics appear more favorable than those of companies like Nexus Select and ...
Read MoreKeystone Realtors Faces Technical Challenges Amidst Market Volatility and Resilience
2025-03-25 08:06:27Keystone Realtors, a midcap player in the construction and real estate sector, has recently undergone an evaluation revision reflecting its current market dynamics. The stock is currently priced at 554.90, showing a slight increase from the previous close of 553.10. Over the past year, Keystone has faced challenges, with a return of -10.91%, contrasting sharply with the Sensex's gain of 7.07% during the same period. In terms of technical indicators, the weekly MACD suggests a bearish sentiment, while the daily moving averages also reflect a bearish stance. The Bollinger Bands indicate a mildly bearish trend on both weekly and monthly scales. The On-Balance Volume (OBV) shows a mildly bearish trend monthly, while the Relative Strength Index (RSI) remains neutral with no significant signals. Despite these technical indicators, Keystone Realtors has shown resilience in the short term, with a weekly return of...
Read MoreKeystone Realtors Faces Mixed Technical Trends Amidst Market Challenges
2025-03-21 08:03:23Keystone Realtors, a midcap player in the construction and real estate sector, has recently undergone an evaluation revision reflecting its current market dynamics. The stock is currently priced at 545.80, showing a slight increase from the previous close of 540.05. Over the past year, Keystone has experienced a decline of 11.63%, contrasting with a 5.89% gain in the Sensex, highlighting the challenges faced by the company in a competitive market. The technical summary indicates a mixed outlook, with various indicators suggesting differing trends. The MACD remains bearish on a weekly basis, while the Bollinger Bands reflect a mildly bearish stance. The moving averages also indicate bearish conditions, which may suggest caution among market participants. However, the Dow Theory shows a mildly bullish trend on a weekly basis, indicating some underlying strength. In terms of performance, Keystone Realtors ha...
Read MoreKeystone Realtors Faces Technical Trend Adjustments Amid Market Performance Variability
2025-03-20 08:04:15Keystone Realtors, a midcap player in the construction and real estate industry, has recently undergone a technical trend adjustment. The company's current price stands at 540.05, slightly above the previous close of 536.55. Over the past year, Keystone has experienced a notable decline of 12.21%, contrasting with a 4.77% gain in the Sensex during the same period. In terms of technical indicators, the MACD reflects a bearish sentiment on a weekly basis, while the moving averages also indicate a bearish trend. The Bollinger Bands show a mildly bearish outlook on both weekly and monthly scales. The On-Balance Volume (OBV) presents a mildly bullish signal weekly, but lacks a definitive trend on a monthly basis. Despite the recent challenges, Keystone Realtors has shown resilience with a 5.28% return over the past week, outperforming the Sensex, which returned 1.92%. Additionally, the company has recorded a...
Read MoreKeystone Realtors Shows Mixed Technical Trends Amid Market Challenges and Adjustments
2025-03-19 08:05:12Keystone Realtors, a midcap player in the construction and real estate sector, has recently undergone an evaluation revision reflecting its current market dynamics. The stock is currently priced at 536.55, showing a slight increase from the previous close of 529.55. Over the past year, Keystone has faced challenges, with a return of -9.07%, contrasting with a 3.51% gain in the Sensex during the same period. The technical summary indicates a mixed performance across various indicators. The MACD shows a bearish trend on a weekly basis, while the moving averages also reflect a bearish stance. However, the On-Balance Volume (OBV) suggests a mildly bullish sentiment on a weekly basis, indicating some underlying strength despite the overall bearish indicators. In terms of volatility, the Bollinger Bands are categorized as mildly bearish on both weekly and monthly scales. The stock has experienced a 52-week high...
Read MoreKeystone Realtors Adjusts Valuation Amidst Challenging Market Conditions and Elevated Metrics
2025-03-19 08:01:02Keystone Realtors, a midcap player in the construction and real estate sector, has recently undergone a valuation adjustment. The company's current price stands at 536.55, reflecting a slight increase from the previous close of 529.55. Over the past year, Keystone has faced challenges, with a return of -9.07%, contrasting with a 3.51% gain in the Sensex during the same period. Key financial metrics for Keystone include a PE ratio of 49.06 and an EV to EBITDA ratio of 30.94, indicating a premium valuation relative to its peers. The company's return on capital employed (ROCE) is reported at 6.67%, while the return on equity (ROE) is at 5.71%. In comparison to its peers, Keystone's valuation metrics appear elevated, particularly when juxtaposed with companies like Nexus Select and Anant Raj, which also exhibit high valuation scores. However, some peers, such as SignatureGlobal and Embassy Develop, are categ...
Read MoreKeystone Realtors Adjusts Valuation Amidst Competitive Market Dynamics in Real Estate Sector
2025-03-07 08:01:27Keystone Realtors, a midcap player in the construction and real estate sector, has recently undergone a valuation adjustment. The company's current price stands at 540.85, reflecting a notable increase from the previous close of 524.25. Over the past week, Keystone has shown a stock return of 6.42%, contrasting with a slight decline in the Sensex, which recorded a return of -0.37%. Key financial metrics for Keystone include a PE ratio of 49.45 and an EV to EBITDA ratio of 31.19. The company's return on capital employed (ROCE) is reported at 6.67%, while the return on equity (ROE) is at 5.71%. These figures indicate a competitive positioning within the industry, although they also highlight the challenges faced in terms of profitability. In comparison to its peers, Keystone's valuation metrics suggest a relatively higher position, particularly when contrasted with companies like Anant Raj and Sobha, which ...
Read More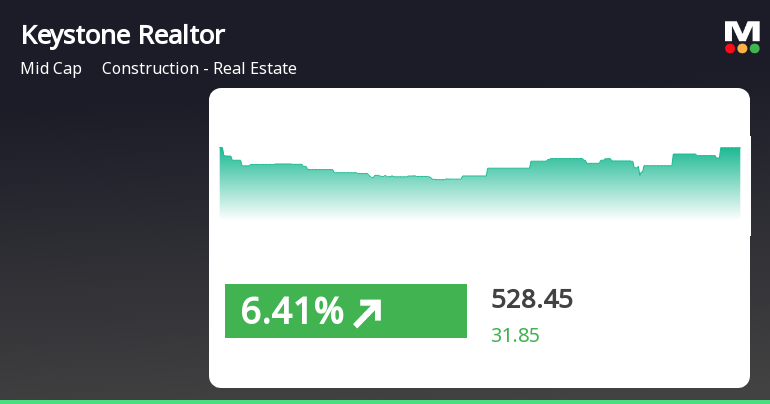
Keystone Realtors Shows Recovery Amid Broader Market Decline and Long-Term Challenges
2025-03-03 18:25:33Keystone Realtors has seen a significant rebound today, recovering from four days of losses. The stock outperformed its sector, although it remains below key moving averages. In the broader market, the Nifty index experienced a slight decline and is near its 52-week low, reflecting ongoing challenges.
Read MoreDisclosure Pursuant To Regulation 30 Of Securities And Exchange Board Of India (Listing Obligations And Disclosure Requirements) Regulations 2015 (The Regulations)
08-Apr-2025 | Source : BSEKey Operational Update for Q4FY2025
Closure of Trading Window
31-Mar-2025 | Source : BSEClosure of Trading Window w.e.f 01.04.2025
Announcement under Regulation 30 (LODR)-Analyst / Investor Meet - Intimation
24-Mar-2025 | Source : BSEThis is to inform that pursuant to Regulation 30(6) of SEBI (Listing Obligations and Disclosure Requirements) Regulations 2015 the schedule of Analyst / Institutional Investor Meeting with the Company is as under: - Date Particulars of Investor / Event Type of Interaction Mode 28-03-2025 Jefferies One on One Virtual Please note that the dates are subject to changes. Changes may happen due to exigencies on the part of investors/ Company
Corporate Actions

No Upcoming Board Meetings

No Dividend history available

No Splits history available

No Bonus history available

No Rights history available


