
L&T Finance Experiences Mixed Technical Signals Amidst Stock Performance Volatility
2025-04-02 08:06:13L&T Finance Ltd, a prominent player in the Finance/NBFC sector, has recently undergone an evaluation revision reflecting shifts in its technical indicators. The stock is currently priced at 150.90, down from a previous close of 153.20. Over the past year, L&T Finance has experienced a high of 194.20 and a low of 129.15, indicating some volatility in its performance. The technical summary reveals mixed signals across various indicators. The MACD shows a mildly bullish trend on a weekly basis, while the monthly perspective leans towards a mildly bearish outlook. Similarly, the Bollinger Bands indicate a mildly bullish trend weekly but are bearish on a monthly basis. Moving averages suggest a mildly bearish stance on a daily basis, while the KST reflects a mildly bullish trend weekly and a mildly bearish trend monthly. In terms of stock performance, L&T Finance has shown resilience compared to the Sensex. Ov...
Read MoreL&T Finance Shows Mixed Technical Trends Amid Market Fluctuations and Strong Returns
2025-04-01 08:02:14L&T Finance Ltd, a prominent player in the Finance/NBFC sector, has recently undergone an evaluation revision reflecting its current market dynamics. The stock is currently priced at 153.20, having closed at 155.60 previously. Over the past year, L&T Finance has experienced fluctuations, with a 52-week high of 194.20 and a low of 129.15. Today's trading saw a high of 156.65 and a low of 152.00. In terms of technical indicators, the weekly MACD and Bollinger Bands suggest a mildly bullish sentiment, while the monthly indicators reflect a mildly bearish outlook. The Relative Strength Index (RSI) shows no significant signals for both weekly and monthly periods. The On-Balance Volume (OBV) remains bullish, indicating a positive accumulation trend. When comparing the stock's performance to the Sensex, L&T Finance has shown notable returns over various periods. In the last month, the stock returned 13.48%, sign...
Read MoreL&T Finance Shows Mixed Technical Trends Amid Strong Market Performance
2025-03-28 08:02:20L&T Finance Ltd, a prominent player in the Finance/NBFC sector, has recently undergone an evaluation revision reflecting its current market dynamics. The stock is currently priced at 155.60, showing a notable increase from the previous close of 152.80. Over the past week, L&T Finance has demonstrated a stock return of 3.87%, significantly outperforming the Sensex, which returned 1.65% in the same period. In terms of technical indicators, the weekly MACD suggests a mildly bullish sentiment, while the monthly perspective leans towards a mildly bearish outlook. The Bollinger Bands indicate a bullish trend on a weekly basis, contrasting with a sideways movement on a monthly scale. The On-Balance Volume (OBV) reflects a bullish stance for both weekly and monthly assessments, indicating strong buying interest. Looking at the company's performance over various time frames, L&T Finance has achieved a year-to-date...
Read More
L&T Finance Faces Technical Shift Amid Declining Institutional Stake and Flat Performance
2025-03-27 08:03:32L&T Finance Ltd has recently experienced a change in its evaluation, reflecting shifts in technical trends. The company's Q3 FY24-25 results showed a decline in operating profit, while institutional investor participation decreased. Despite a negative return over the past year, profits increased, and the stock trades at a premium compared to peers.
Read MoreL&T Finance Shows Mixed Technical Trends Amid Strong Relative Performance Against Sensex
2025-03-26 08:02:58L&T Finance Ltd, a prominent player in the Finance/NBFC sector, has recently undergone an evaluation revision reflecting its current market dynamics. The company's stock is currently priced at 154.45, down from a previous close of 158.55, with a 52-week high of 194.20 and a low of 129.15. Today's trading saw a high of 160.40 and a low of 153.45. In terms of technical indicators, the weekly MACD and KST suggest a mildly bullish sentiment, while the monthly indicators show a mildly bearish trend. The Relative Strength Index (RSI) remains neutral for both weekly and monthly assessments, indicating a lack of strong momentum in either direction. The Bollinger Bands reflect a mildly bullish trend on a weekly basis, contrasting with a sideways movement on a monthly scale. When comparing L&T Finance's performance to the Sensex, the company has shown notable returns over various periods. Over the past week, L&T F...
Read More
L&T Finance Adjusts Technical Outlook Amid Flat Financial Performance and Investor Caution
2025-03-24 08:02:28L&T Finance Ltd has experienced a recent evaluation adjustment reflecting a shift in its technical outlook, supported by indicators like MACD and Bollinger Bands. Despite flat financial performance for the quarter ending December 2024, the company reported a 13% rise in profits, though long-term growth remains challenged.
Read MoreL&T Finance Shows Mixed Technical Trends Amidst Strong Market Performance
2025-03-24 08:01:33L&T Finance Ltd, a prominent player in the Finance/NBFC sector, has recently undergone an evaluation revision reflecting its current market dynamics. The stock is currently priced at 155.25, showing a notable increase from the previous close of 149.80. Over the past year, L&T Finance has experienced a 52-week high of 194.20 and a low of 129.15, indicating a volatile trading range. In terms of technical indicators, the weekly MACD suggests a mildly bullish sentiment, while the monthly perspective remains mildly bearish. The Bollinger Bands indicate a bullish trend on a weekly basis, contrasting with a sideways movement monthly. The On-Balance Volume (OBV) is bullish for both weekly and monthly assessments, suggesting positive trading volume trends. When comparing L&T Finance's performance to the Sensex, the company has shown impressive returns over various periods. For instance, in the last week, L&T Finan...
Read More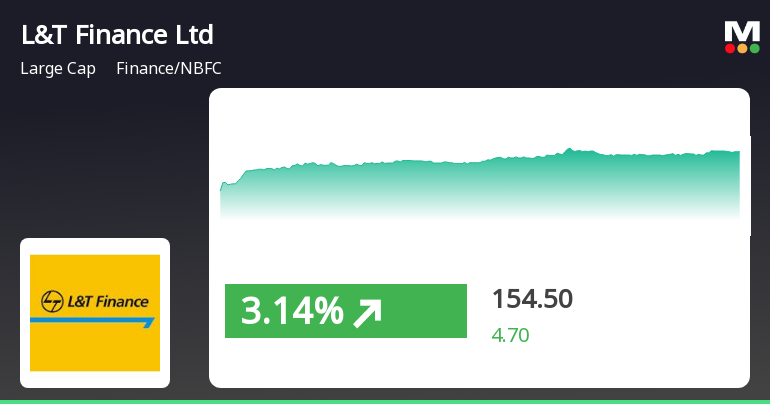
L&T Finance Demonstrates Resilience Amid Fluctuating Market Conditions
2025-03-21 12:35:18L&T Finance has demonstrated strong performance, gaining 3.2% on March 21, 2025, and achieving an intraday high of Rs 155. The stock has outperformed its sector and shows resilience in a fluctuating market, with notable returns over the past week despite mixed trends in moving averages.
Read More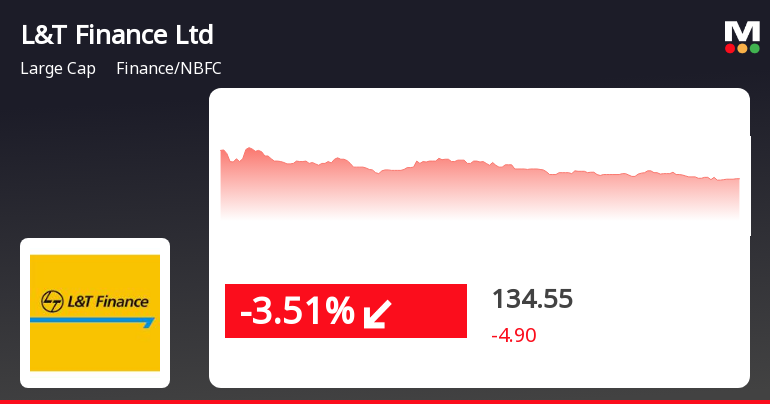
L&T Finance Faces Challenges Amid Sector Volatility and Mixed Momentum Indicators
2025-02-28 11:20:15L&T Finance saw a decline on February 28, 2025, closing at Rs 135, slightly above its 52-week low. The stock's performance indicates underperformance compared to its sector and broader market trends, with mixed short-term momentum reflected in its moving averages. The Finance/NBFC sector continues to face challenges.
Read MoreAnnouncement under Regulation 30 (LODR)-Analyst / Investor Meet - Intimation
09-Apr-2025 | Source : BSEPlease find enclosed intimation for Investor(s) / Analyst(s) meet - Q4FY2024-25 and FY2025 Financial Performance and Strategy Update.
Board Meeting Intimation for Audited Financial Results For The Period Ended March 31 2025 And Dividend.
07-Apr-2025 | Source : BSEL&T Finance Ltdhas informed BSE that the meeting of the Board of Directors of the Company is scheduled on 25/04/2025 inter alia to consider and approve Audited financial results for the period ended March 31 2025 and dividend.
Company Business Update - Information For The Quarter And Financial Year Ended March 31 2025.
03-Apr-2025 | Source : BSEPlease find enclosed Business Update for the quarter and financial year ended March 31 2025.
Corporate Actions

No Upcoming Board Meetings

L&T Finance Ltd has declared 25% dividend, ex-date: 18 Jun 24

No Splits history available

No Bonus history available

L&T Finance Ltd has announced 17:74 rights issue, ex-date: 21 Jan 21


