Vardhman Textiles Shows Strong Short-Term Gains Amid Broader Market Volatility
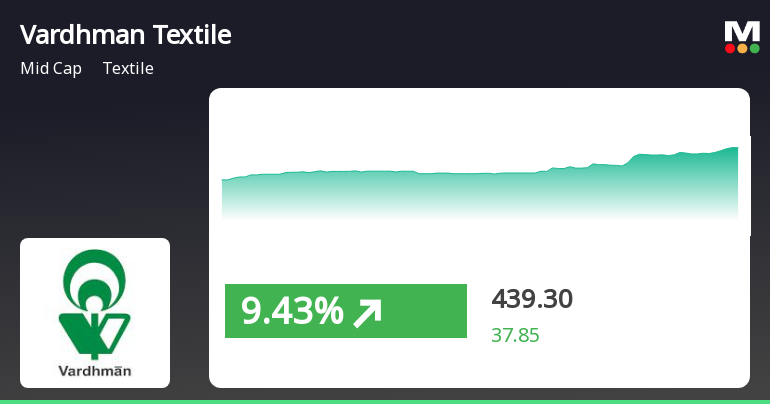
2025-04-03 10:35:15Vardhman Textiles has demonstrated notable performance, gaining 7.36% on April 3, 2025, and achieving a total return of 6.1% over three consecutive days. The stock is currently above its short-term moving averages but below longer-term ones. In the broader market, the Sensex showed volatility, with small-cap stocks leading.
Read MoreVardhman Textiles Faces Mixed Technical Trends Amid Market Evaluation Revision
2025-04-03 08:02:25Vardhman Textiles, a midcap player in the textile industry, has recently undergone an evaluation revision reflecting its current market dynamics. The stock is currently priced at 401.45, showing a slight increase from the previous close of 397.20. Over the past year, Vardhman Textiles has faced challenges, with a return of -9.77%, contrasting with a 3.67% gain in the Sensex during the same period. The technical summary indicates a mixed outlook, with various indicators such as MACD and Bollinger Bands suggesting a mildly bearish stance on both weekly and monthly bases. The moving averages present a bearish trend on a daily scale, while the On-Balance Volume (OBV) remains bullish, indicating some underlying strength in trading volume. In terms of stock performance, Vardhman Textiles has shown resilience over a longer horizon, with a remarkable 225.01% return over the past five years, significantly outperfo...
Read MoreVardhman Textiles Faces Technical Trend Challenges Amidst Market Fluctuations
2025-04-02 08:03:44Vardhman Textiles, a midcap player in the textile industry, has recently undergone an evaluation revision reflecting its current market dynamics. The stock is currently priced at 397.20, showing a slight increase from the previous close of 394.00. Over the past year, Vardhman Textiles has faced challenges, with a return of -10.01%, contrasting with a positive return of 2.72% for the Sensex during the same period. The technical summary indicates a bearish sentiment in the weekly MACD and moving averages, while the monthly indicators show a mildly bearish trend. Notably, the Bollinger Bands and KST also reflect a similar mildly bearish stance on a monthly basis. The Relative Strength Index (RSI) shows no significant signals, suggesting a period of consolidation. In terms of performance, Vardhman Textiles has experienced a notable decline year-to-date, with a return of -21.96%, while the Sensex has only dipp...
Read MoreVardhman Textiles Faces Mixed Technical Trends Amid Market Evaluation Revision
2025-03-27 08:01:19Vardhman Textiles, a midcap player in the textile industry, has recently undergone an evaluation revision reflecting its current market dynamics. The stock is currently priced at 404.80, showing a slight increase from the previous close of 399.55. Over the past year, Vardhman Textiles has experienced a decline of 8.39%, contrasting with a 6.65% gain in the Sensex, indicating a challenging performance relative to the broader market. The technical summary reveals a mixed outlook. The MACD indicates bearish trends on a weekly basis, while the monthly perspective shows a mildly bearish stance. The Bollinger Bands and KST also reflect similar mildly bearish sentiments. However, the On-Balance Volume (OBV) suggests bullish momentum on both weekly and monthly charts, indicating some underlying strength. In terms of returns, Vardhman Textiles has shown a notable performance over the long term, with a remarkable 2...
Read MoreVardhman Textiles Faces Technical Challenges Amidst Long-Term Resilience in Market Dynamics
2025-03-20 08:01:21Vardhman Textiles, a midcap player in the textile industry, has recently undergone an evaluation revision reflecting its current market dynamics. The stock is currently priced at 385.45, showing a slight increase from the previous close of 379.50. Over the past year, Vardhman Textiles has faced challenges, with a return of -9.93%, contrasting with a positive return of 4.77% from the Sensex during the same period. The technical summary indicates a bearish sentiment in the weekly MACD and moving averages, while the monthly indicators show a mildly bearish trend. The Bollinger Bands and KST also reflect a similar cautious outlook. Notably, the stock's performance over various time frames reveals a significant decline, particularly in the year-to-date return of -24.27%, compared to the Sensex's -3.44%. Despite these challenges, Vardhman Textiles has demonstrated resilience over the long term, with a remarkabl...
Read MoreVardhman Textiles Faces Mixed Technical Trends Amidst Market Challenges
2025-03-19 08:01:54Vardhman Textiles, a midcap player in the textile industry, has recently undergone an evaluation revision reflecting its current market dynamics. The stock is currently priced at 379.50, showing a slight increase from the previous close of 363.95. Over the past year, Vardhman Textiles has faced challenges, with a return of -9.70%, contrasting with a positive return of 3.51% for the Sensex during the same period. The technical summary indicates a mixed outlook, with various indicators reflecting differing trends. The MACD shows bearish signals on a weekly basis, while the monthly perspective leans towards a mildly bearish stance. The Relative Strength Index (RSI) presents no signal on a weekly basis but indicates bullish momentum monthly. Bollinger Bands and KST also reflect a mildly bearish trend, while the Dow Theory suggests a mildly bullish outlook on a weekly basis. In terms of stock performance, Vard...
Read MoreVardhman Textiles Adjusts Valuation Grade Amid Competitive Industry Landscape
2025-03-18 08:00:27Vardhman Textiles, a midcap player in the textile industry, has recently undergone a valuation adjustment, reflecting a shift in its financial standing. The company currently exhibits a price-to-earnings (PE) ratio of 12.43 and a price-to-book value of 1.12, indicating a moderate valuation relative to its earnings and assets. Its enterprise value to EBITDA stands at 7.89, while the enterprise value to sales ratio is 1.04, suggesting a balanced approach to revenue generation. In terms of profitability, Vardhman Textiles reports a return on capital employed (ROCE) of 9.11% and a return on equity (ROE) of 8.45%. The company also offers a dividend yield of 1.10%, which may appeal to income-focused investors. When compared to its peers, Vardhman Textiles shows a competitive edge in certain financial metrics. For instance, its PEG ratio of 0.29 is notably lower than that of some competitors, indicating a potent...
Read MoreVardhman Textiles Adjusts Valuation Amidst Competitive Textile Industry Landscape
2025-03-11 08:00:12Vardhman Textiles, a midcap player in the textile industry, has recently undergone a valuation adjustment. The company's current price stands at 387.30, reflecting a decline from the previous close of 398.30. Over the past year, Vardhman has experienced a stock return of -12.36%, contrasting with a negligible change in the Sensex during the same period. Key financial metrics for Vardhman Textiles include a PE ratio of 13.23 and an EV to EBITDA ratio of 8.41, indicating its current market positioning. The company also reports a dividend yield of 1.03% and a return on capital employed (ROCE) of 9.11%. In comparison to its peers, Vardhman Textiles shows a more favorable PEG ratio of 0.30, while competitors like Swan Energy and Alok Industries are categorized as risky, with significantly higher PE ratios and negative performance indicators. Other peers, such as Arvind Ltd and Raymond, exhibit stronger valuat...
Read More
Vardhman Textiles Faces Continued Volatility Amidst Declining Performance Metrics
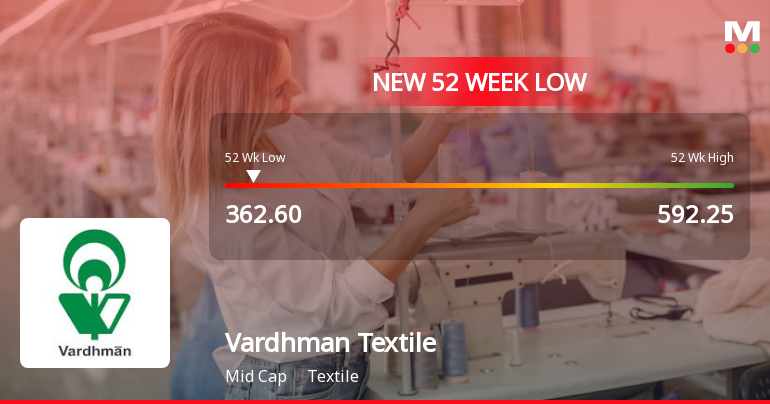
2025-03-04 09:53:34Vardhman Textiles has faced notable volatility, reaching a new 52-week low and continuing a six-day losing streak. The stock underperforms its sector, with a significant annual return decline. Financial metrics show modest growth in sales and profits, while institutional holdings remain relatively high despite ongoing challenges.
Read MoreDemat Report For The Month Ended March 2025.
08-Apr-2025 | Source : BSEPlease find enclosed herewith Demat Report for the month ended March 2025.
Compliances-Certificate under Reg. 74 (5) of SEBI (DP) Regulations 2018
05-Apr-2025 | Source : BSEPlease find enclosed herewith Certificate under Reg. 74(5) of SEBI (DP) Regulations 2018.
Closure of Trading Window
03-Apr-2025 | Source : BSEPlease find enclosed herewith intimation regarding Closure of Trading Window.
Corporate Actions
No Upcoming Board Meetings
Vardhman Textiles Ltd has declared 200% dividend, ex-date: 06 Sep 24
Vardhman Textiles Ltd has announced 2:10 stock split, ex-date: 24 Mar 22
No Bonus history available
No Rights history available


